
ZAPS Psychology Labs work on computers, tablets, and smartphones. This page provides details on which devices and browsers are best for accessing ZAPS, and gives an illustrated walkthrough of the steps completed by students in each lab.
How do I get started using ZAPS?
There is a great Getting Started resource available on the Digital Resources page for your textbook or ZAPS.
- Go to the Digital Resources page for your textbook. The link starts with https://digital.wwnorton.com/ and ends with the short title of your textbook. If you need help finding the link for your textbook, please contact your Norton representative.
- For example, here is the link for the Digital Resources page for ZAPS: https://digital.wwnorton.com/zaps2
- Login to the Digital Resources page using your Norton account. Please note, to access the Getting Started resource specially designed for instructors, your Norton account needs to be authorized as an instructor. If you need to have your account authorized as an instructor, please contact your Norton representative.
- Click on the Getting Started tile:

Which devices and browsers are best for accessing ZAPS?
To view minimum system requirements for using ZAPS, please click here.
How do students complete ZAPS activities?
To complete a ZAPS activity, students must:
- Watch the video and/or read the text in the Introduction section.
- Complete the experiment in the Experience section.
- View and understand the meaning of the graph in the Your Data section.
- Read through the Discussion section.
- Complete the multiple-choice questions in the Learning Check section.
90% of your students' grades will be based on completing the Experience and answering any questions in the Experience, Your Data, and Discussion sections. The other 10% of your students' grades will be determined by their performance on the Learning Check questions.

Launching an Activity
If your students have not yet joined a Student Set, they will be asked to join a Student Set each time they launch an activity. To join a Student Set, students enter their Student Set ID number in the Student Set ID: field and click the OK button. Students can dismiss this window without adding a Student Set ID by clicking the I don't have a Student Set ID at this time button.
If ZAPS is integrated within your campus learning management system (Blackboard, Canvas, Moodle, etc.), your student will not be asked to join a Student Set if they launch the activity using an integrated link within your LMS course. When students login the first time when using a LMS-integrated link, they will be automatically added to the proper Student Set.

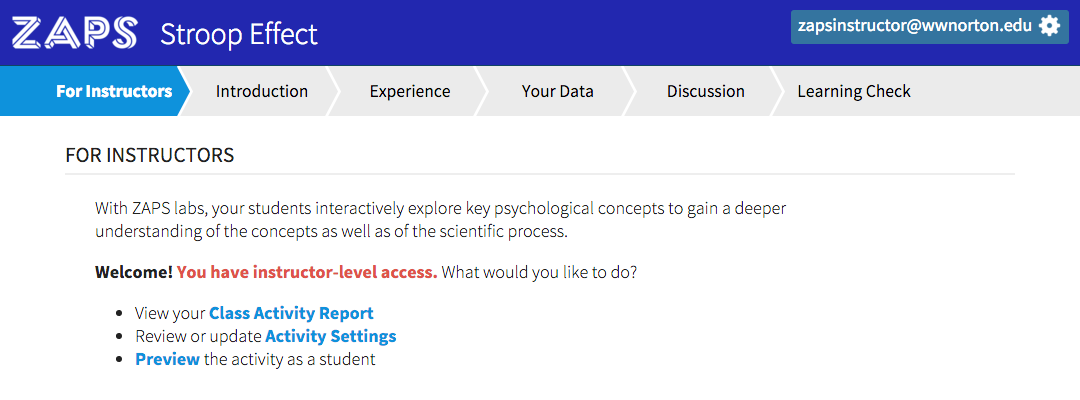
When you launch an activity while logged in as an instructor, you will see the For Instructors tab (this tab is only visible to instructors, not students). You can use the links on the For Instructors tab to access the Class Activity Report and Activity Settings for the selected activity. As an instructor, you can access any tab of the activity at any time. However, your students will need to progress sequentially through each activity. To experience how your students will complete the selected activity, click on the Preview link.
Introduction Section
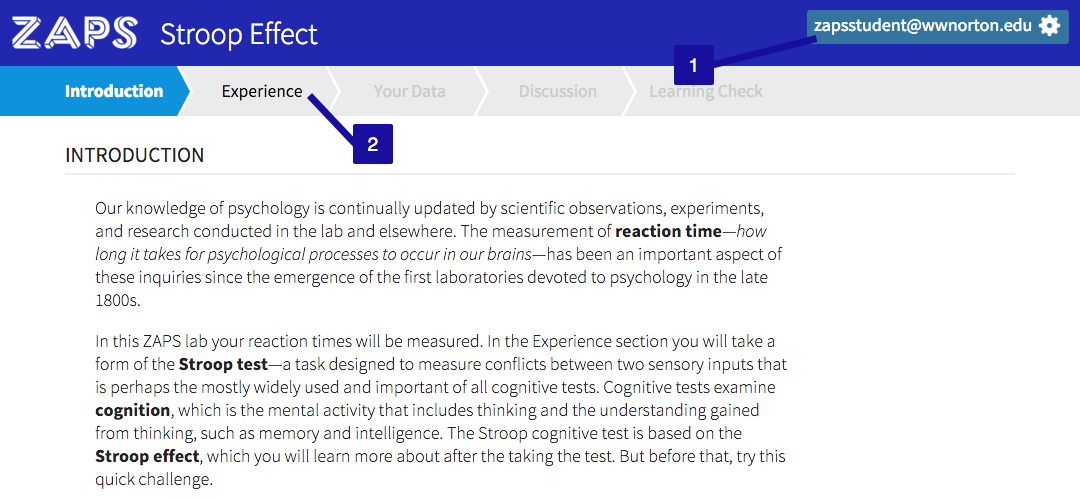
- You can access the activity tools at any time during the activity by clicking the gear icon in the upper right corner.
- Use these tabs to progress through the activity. You must proceed sequentially through the activity and complete one section before moving on to the next. After you have finished reviewing the information presented on the Introduction tab, click on the Experience tab to move to the next section.
Experience Section
Before beginning the trials of an experiment, a box may appear that contains the instructions on how to complete that specific experiment. Please read this information carefully.

You may need to answer a question about how to complete the upcoming trials in order to begin. After you answer the question, click the Got It button to proceed to the experiment trials.

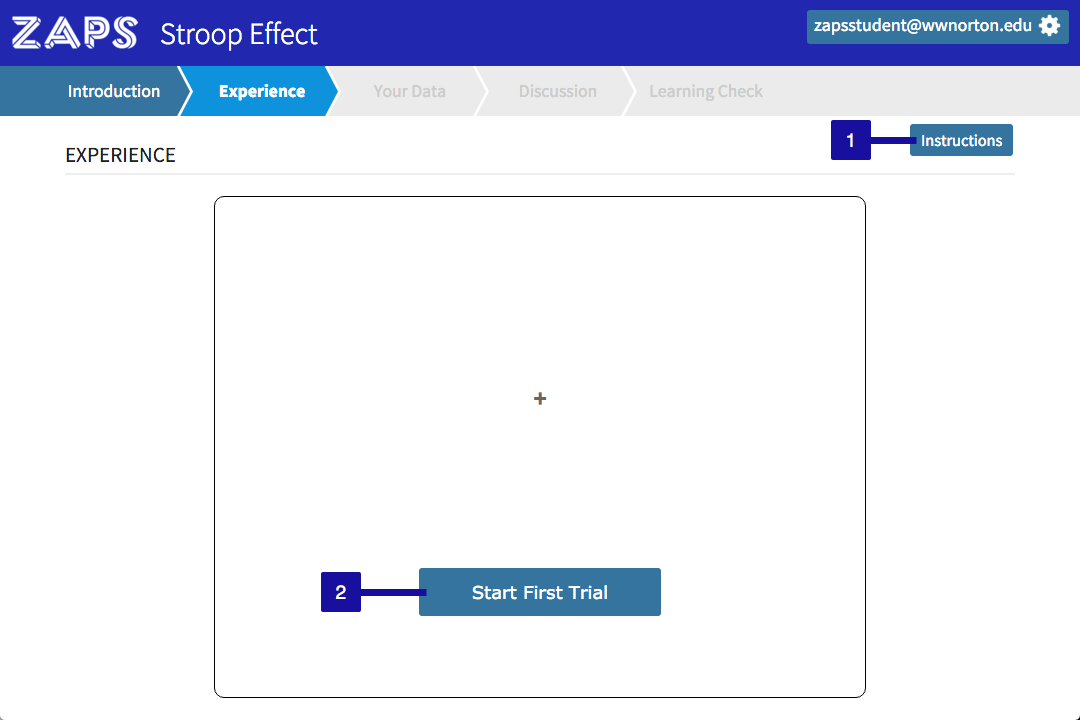
- If you need a reminder of how to complete the activity, click on the Instructions button in the upper right corner.
- Click on the Start button to begin the experiment trials. If there are multiple sections of the experiment, you will need to click the Start button to begin each section.
You will receive this message after completing all of the trials in the experiment. Click on the Your Data tab to review your experiment data.

Your Data Section
When arriving on the Your Data tab for the first time, the Data Introduction window may be displayed. This introduction will explain how to understand your results from the experiment you just completed.

You may need to answer a question about how to understand your results before being able to close the Data Introduction window. After you answer the question, click the Got It button to proceed to the Your Data tab.

Graph Tab
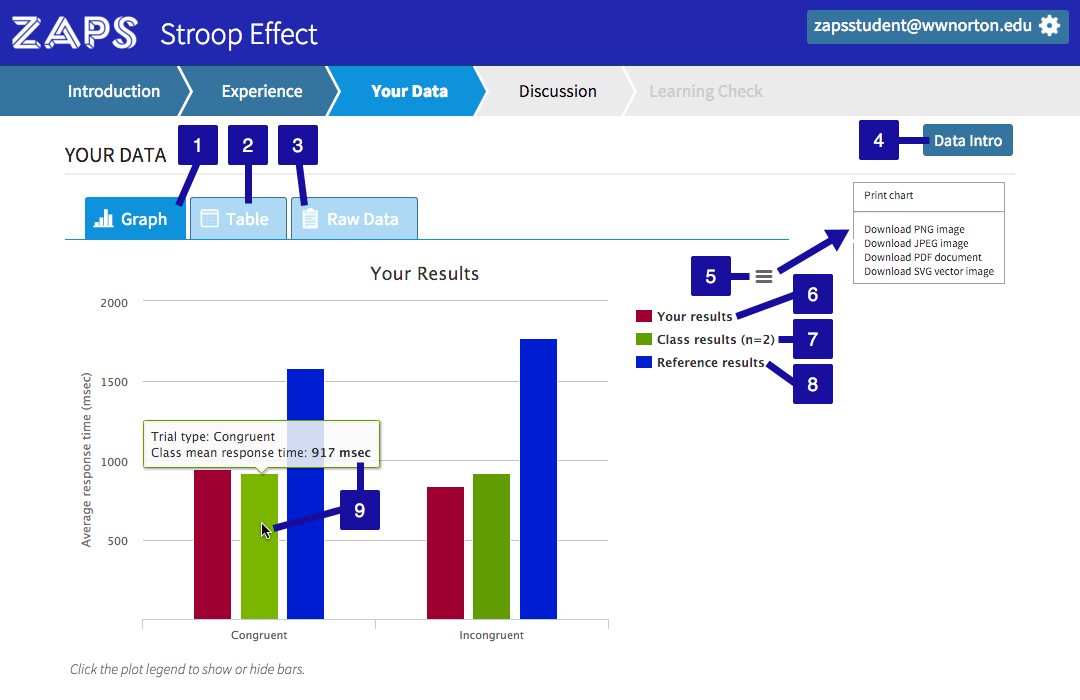
- The Graph tab will display a graph of your results, which can be compared to the reference and class results.
- The Table tab will display a chart that includes your results, the class results, and the reference data results (details below).
- The Raw Data tab will display a chart of your complete trial data (details below).
- Click the Data Intro button to reopen the Data Introduction window.
- Click the menu icon to access the print menu. You can print or download the graph in a number of different formats.
- Your results are displayed in red. Click on the Your results link to hide or display that information on the graph.
- The class results are displayed in green. Click on the Class results (n=#) link to hide or display that information on the graph. If you were the first one to complete the activity, you will not see the class results category; at least two data submissions are required to view the class results category. The (n=#) identifies how many submissions are currently included within the class results (ex. n=2 means that the class results data is made up of 2 submissions). You must be enrolled in a Student Set for class results to be displayed.
- The reference results are displayed in blue. Click on the Reference results link to hide or display that information on the graph.
- Hover your cursor over a point in the graph to view detailed information about those results.
Table Tab
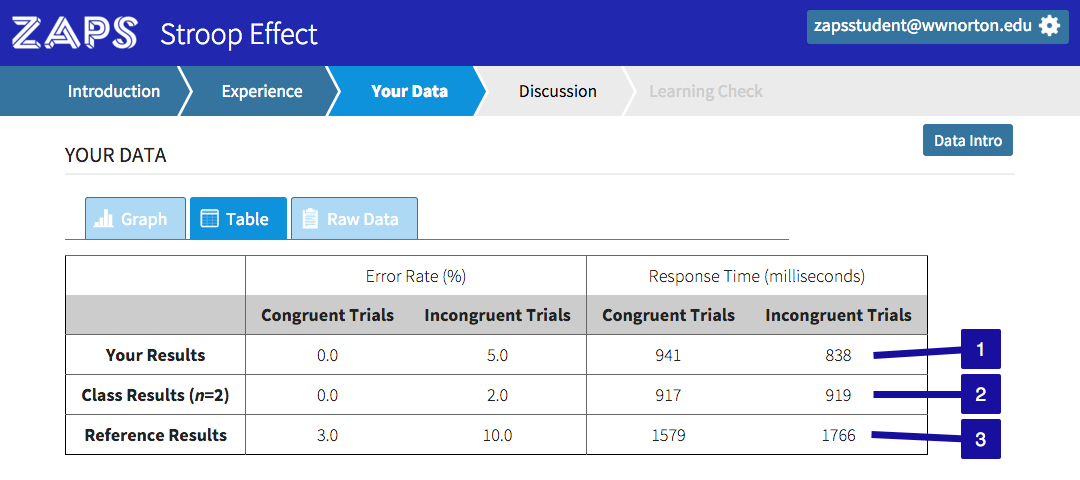
- This row displays the average results for your submission of the experiment trials.
- This row displays the average results for the class submissions of the experiment trials. If you were the first one to complete the activity, you will not see the Class Results row; at least two data submissions are required to view the class results row. The (n=#) identifies how many submissions are currently included within the class results (ex. n=2 means that the class results data is made up of 2 submissions). You must be enrolled in a Student Set for class results to be displayed.
- This row displays the average results for all submissions collected for this experiment across the country.
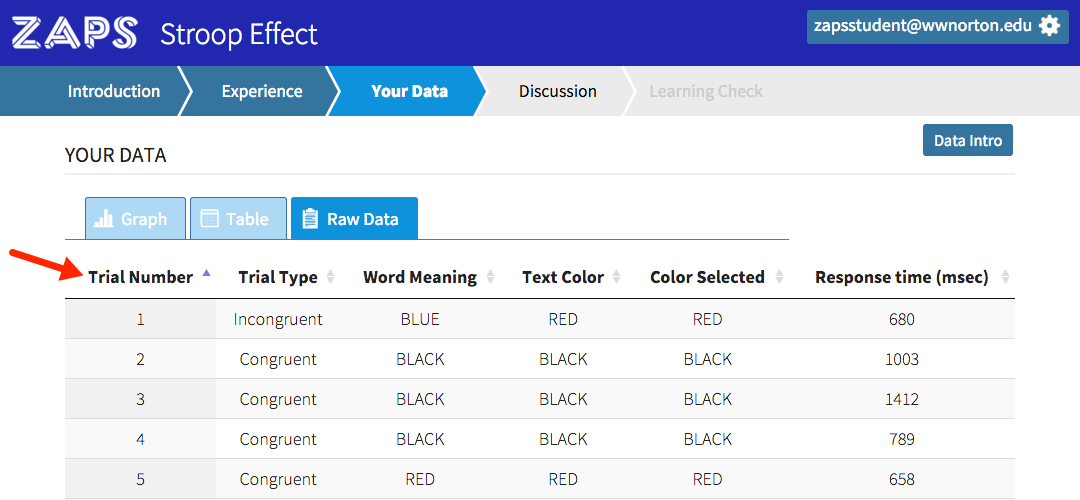
Raw Data Tab
The chart displays your responses for each trial of the experiment. Each column is sortable based on the information presented in that column. Click on the header title in each column to sort the information based on that category, either ascending or descending.
After you have finished reviewing the Your Data tab, click on the Discussion tab to move to the next section of the activity.
Discussion Section
The purpose behind the experiment trials you just completed will be discussed in greater detail in this section. You may be required to answer a few questions before moving on to the Learning Check section. As mentioned above the Submit Answer button for each free-response question, you will receive full credit automatically after submitting your response. However, your response can later be reviewed and your instructor can adjust your grade manually depending on the accuracy or thoughtfulness of your answer.

You will receive this message upon completing all of the required questions in the Discussion section. Click on the OK button to move on to the Learning Check section.

Learning Check Section
The Learning Check section counts towards 10% of your final grade. 90% of your final grade was compiled from your responses to the questions in the previous sections as well as the completion of the experiment trials.
Answer each question to complete the activity and receive your final grade. Once finished, you will receive the message below. Please remember, your final grade can change at your instructor's discretion depending on your answers to the free-response questions. Click on the OK button to close the completion and final grade window.

The Activity Complete and green checkmark badge will appear to the left of the gear icon after completing the activity. Your grade will also be displayed.

Submit a Support Request
Still need help? Submit a support ticket and a customer support specialist will be happy to assist you.
Opened a request already? Click here for an update.