
3D Molecular Visualization Module
The 3D Molecular Visualization module (3DMV) within the Smartwork system allows students to visualize, manipulate, and analyze three-dimensional structures of proteins and nucleic acids that have had their three-dimensional structures solved and deposited into the Protein Data Bank (pdb). Many chapters of the Biochemistry textbook have one or more associated “PDB” questions that use the 3DMV. For these questions, the pdb coordinates, and structure, of a biological macromolecule discussed in the textbook have been loaded into the introduction of the question, shown in the Figure 1 below.
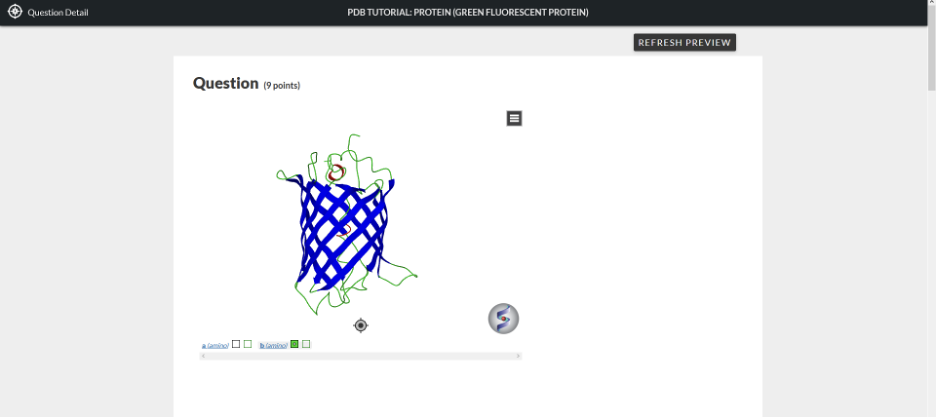 Figure 1
In order to manipulate this structure in the 3D molecular visualization, you can either work within this window or open a new separate window that has the 3D molecular visualization viewer. To open up a separate window to view the structure, hover over the structure and double-click the left button of your mouse.
Moving the Molecule and Selecting Components
To rotate the view of the molecule in the 3DMV Designer, left-click and continue holding the left mouse button down as you move your mouse around. This will rotate the molecule. If you are using a device with a touch screen, then you can rotate the molecule with finger dragging.
To zoom in or out of the molecule in the 3DMV Designer, use the scroll button on the mouse or, if you are using a device with a touch screen, use the finger and thumb “pinching in and out” method.
To select components
Along the bottom there are words in blue indicating specific components of the structure, and each has two boxes next to it. (This is shown by the red circle and arrow in Figure 3 below). The component titles are labelled in parenthesis as indicated in Figure 2:
 Figure 2
- Protein structures: “amino” for amino acids
- DNA or RNA structures: “nucl” for nucleic acids
- Co-factors: various names
The first box, if checked, selects that component such that it is visualized on the screen. When analyzing more complicated structures, it is useful to “hide” parts of the structure by unchecking this box.
Figure 3 below shows a structure that contains proteins, nucleic acids, and several co-factors. The names of the different parts of the complex along the bottom of the viewer are zoomed in for clarity. The user may need to scroll across in order to see all the names.
 Figure 3: The figure above shows DNA complexed with two different amino acid strands and multiple co-factors. The (nucl) stands for nucleic acids, (amino) for the different proteins, and the multiple co-factors have different names.
The second box after these names along the bottom of the viewer allows the user to select or de-select all of the parts of that particular component. Selection of the component is indicated by green “x’s” on the structure (see Figure 4). This selection must be done if the user wants to change the display type or coloring of that part of the molecule.
Dropdown Menu Basics: Coloring and Display Style
The dropdown menu is found in the upper right-hand corner of the structure viewing window, circled in red in Figure 4 below.
 Figure 4: The green “x’s” in this figure show when one of the protein chains in the green fluorescent protein structure has been fully selected. The dark gray square with three horizontal lines in the upper right-hand corner that has been circled in red is the dropdown menu. Please note that the red circle and arrow are not present in the actual visualization window but were added here to emphasize the location of the boxes referred to.
Once selected, the user can use the dropdown menu to change the display or coloring of the molecule. Click the left button of your mouse to display the dropdown menu, shown below.
 Figure 5: After clicking on the dropdown menu button, a selection of tools becomes visible.
To change how the structure is displayed, first click on its current representation (ribbon in this figure), and then click on the preferred selection (Figure 6).
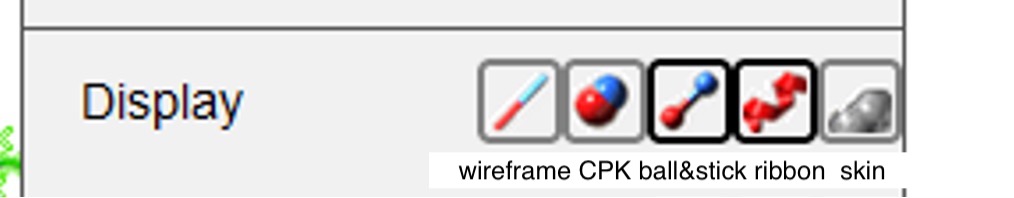 Figure 6: From left to right, the buttons next to “Display” represent the following macromolecule representation styles: wireframe, CPK spacefill, ball and stick, ribbon, and skin. You can also change the coloring preference in your structure by hovering over the phrase “Color by” in the dropdown menu (see next Figure) and making your selection.
 Figure 7: Using this option, a user can color by the different types of atoms (“atom type” or “atom type (hetero)”), different chains (“Chain,” if there is more than one chain in the structure), from the N to C terminus (“NtoC”), by secondary structures (“Secondary structure”), by temperature factor (“Bfactor”), or using a custom coloring scheme.
After you have made your display and coloring selections, deselect (uncheck) the second box after the name of the component you are working with (“b(amino)” in this example).
 Figure 8: This figure shows the protein structure using the CPK representation, colored by atom type.
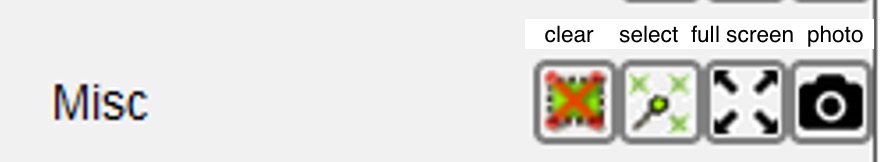 Figure 9: The options after the “Misc” in the dropdown menu, from left to right, allow the user to clear the selection, select neighbors, go to full screen, or take a picture of the image. The atoms must be selected to use these options.
Selecting Specific Areas or Residues
Two other toolboxes in the dropdown menu, the “Labels” tools and the “Measure” tools are used in many types of problems, but they generally have limited utility if all atoms in a structure are selected. To make good use of these tools, the user must select specific atoms.
 Figure 10: This shows a zoom-in of the dropdown menu. Although the “Labels” and “Measure” tools can be used when all atoms in a component of the structure are selected, they are generally more useful when specific atoms have been selected. Please note that the red arrows are not present in the actual visualization window but were added here to emphasize the location of the boxes referred to.
To select a specific area of the molecule, first method: To select a certain region of a molecule, hover over the area, right-click your mouse, and continue holding the right button down as you expand the resulting "black box" to cover the area you are interested in. Release the mouse button when the area is where you desire. A small green x (or green x's) should appear in your selected area.
 Figure 11: This figure shows that the atoms of one terminus of this protein have been selected using the first method described above.
To select a specific residue of the molecule, second method: View the particular residue or sequence of residues (amino acid for protein structure, or nucleotide for nucleic acid structure), and select "View" and "Sequence View" on the dropdown menu. To select a particular residue for labeling, hold down the left button on your mouse while you scroll over that residue, or residues. Small green x’s should appear in the viewer once you do this, while the letters representing the residues in the sequence viewer will become highlighted in blue and surrounded by blue “thought bubbles.”
 Figure 12: This figure shows where to select the “Sequence View” from the dropdown menu. This will give the sequence of amino acids in proteins, or the sequence of nucleotides in a nucleic acid. If your structure has more than one component, you have to select one at a time to show the sequence.
 Figure 13: This figure shows one strand of B-DNA, a nucleic acid. Using the sequence viewer, only the first nucleotide (“C” for cytosine) is selected.
Now that two methods of selecting specific areas of residues of your structure are clear, let’s explore the labeling and measuring tools from the dropdown menu.
Labeling
First, for labeling, you can label your selected component by, from left to right after “Labels,” the atom (“ATOM hb1”), the residue (“RES A5”), or the site (“SITE S”); see Figure 14. Atom and site labeling are self-explanatory, while residue labeling means labeling by either amino acid or nucleotide, using the 1 letter code and the number on the residue in the structure (1 = N terminus, or 1 = 5’ end).
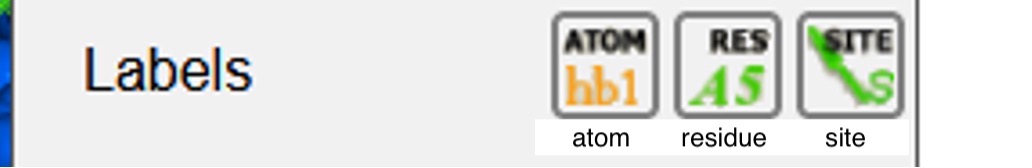 Figure 14: The different labeling options available.
To label: After selecting the general area, or individual residues you want to label (should have green x’s in the visualization window), scroll to “Labels” in the dropdown menu and select which labeling you want. You may have to rotate your molecule to view the labels well.
 Figure 15: This figure shows a protein structure that has had an “area” selected for labeling, and is labeled with residue labeling. A1, for example, stands for alanine on the N terminus of the protein.
 Figure 16: This figure shows the nucleic acid strand with the first nucleotide (C1) selected and labeled with atoms, instead of by residue. In the original blue CPK display of this nucleic acid, the labels were not visible. Therefore, the display type and color of the nucleic acid was changed so that the labels would be visible. Other than “C1,” the specific atom labels are not decipherable. For many questions, the user will have to rotate the molecule in order to visualize individual labels when multiple atoms are labeled.
Measuring
The measuring tools from the dropdown menu, from left to right are: distance, planar angles, torsion angles, and delete all measurements.
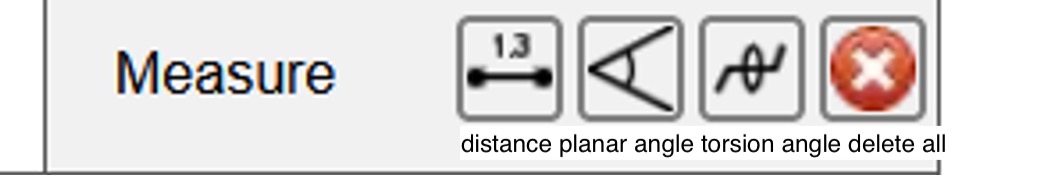 Figure 17: This figure shows the different measuring options; the most common of which is distance.
To Measure: First, the molecule should be displayed either in ball and stick or CPK representation. Next, deselect all residues in your molecule (there should not be any green x’s on the structure). Click on the measure tool from the dropdown menu. To measure between two atoms, click on the first and then the second atom. A small green x will appear on the atom (s) you selected, and a black line with a distance measurement will appear next to it. In order to ensure you have measured the correct component, it is often helpful to label relevant residues prior to measuring.
 Figure 18: In this figure, two different areas of the protein were selected and the display was changed to CPK. The distance was measured between two atoms, and the black 8.12 displayed is the distance between those two atoms linked by the black line, in Angstroms.
 Figure 19: In this figure, the planar angle between three atoms of a nucleic acid was determined. Three different residues were selected and displayed in the ball and stick representation. Then, the planar angle button from the measuring tool in the dropdown menu was chosen, followed by clicking on all three atoms sequentially. The 87.4 is the planar angle between these atoms.
 Figure 20: This figure shows a complex molecule that contains DNA, protein, and co-factors, with multiple distances measured. For all the measurements, the atoms of interest must be displayed as either CPK or ball and stick for the measurement tools to function. In this figure the distance between two co-factors (9.2), a co-factor and an atom in the DNA (14.2, although 1 is hidden by structure), the major groove of the DNA (16.3), and between an atom of the DNA and the terminus of one of the protein strands (16.4) are all displayed, with the distance unit being Angstroms in all cases.
 Figure 21: In this figure, the sequence viewer was used to select individual amino acids, in the case A1 and T230 (the N and C terminus amino acids of this protein), and the distance between these two measured (19.3). The amino acid display style was changed to CPK, and the amino acids were labeled. The molecule was rotated and zoomed in such that the two residues of interest were clear, and the measuring distance tool was then used to measure the desired distance.
Miscellaneous
There are other functions in the 3D Molecular Visualization Module, especially in the dropdown menu. However, the abilities to select certain components of a structure, to select areas or specific residues of a structure, to change the display type, to label components, and to use the measuring tools are by far the most important functionalities to understand in order to complete Smartwork questions using this module.
Submit a Support Request
Still need help? Submit a support ticket and a customer support specialist will be happy to assist you.
Opened a request already? Click here for an update.