
Reviewing the graphing tool directions below will help you understand how to use each tool correctly.
Tips to Get Started
- Read and understand the directions before submitting your graphing attempt.
- If your attempt is marked incorrect and it looks visually correct, try resetting your graph to submit a new attempt.
- If you are submitting additional attempts, do not draw extra points, lines or areas you’ve already submitted. You may wish to reset the graph between attempts to remove the previous incorrect answer. Adding extra points, lines or areas on top of existing ones may result in your graph to display an error message or marked incorrect.
- Make sure your browser is set to "Actual Size" or 100% to ensure your graph is being displayed correctly.
Student Directions
To view a video walk-through of this information, click here.
Graphing questions can be answered in a number of ways: they may require dragging a curve, plotting a point, drawing a straight line, drawing a curved line, plotting an area, or labeling a curve. These instructions will walk you through each question type.
When you start a graphing question, you will see a screen like this:
The toolbar at the top of the screen contains all possible graphing tools. You will not use all the tools in each question, though you will sometimes need to use more than one tool. For each question, you will be instructed which tool to use and the tools required will be the only ones accessible to you (the tools not required will be grayed out). A question that instructs you to use more than one of these tools (such as “use the point tool to plot points and then the curved-line tool to connect them) will require that you use both of them for the question to be graded correct. The order doesn’t matter – you can use whichever tool that you would prefer first – but you must use both the tools listed. You also always have access to undo, redo, or reset a question.
Toolbar


Drag tool - This tool can be used to drag lines and points, or to shift a curve. If you are drawing a curve and need to move a segment, you will use this tool to shift the segment. In questions, the instructions “Drag the appropriate curve” signify you should use this tool.

Point tool - This tool can be used to place points on the graph. Note that when you select the tool for use, it will highlight in blue so you always know which tool is selected.

Straight-line tool - This tool can be used to draw straight lines between two points that you indicate, such as Demand and Supply curves (in economics, straight lines are known as curves with a constant slope).

Curved-line tool - This tool can be used to draw curves with a varying slope, such as Production Possibility Frontiers or Average Total Cost curves.

Area tool - This tool can be used to draw shapes and areas, such as the expected profit in a scenario where tariffs are applied. In questions, the instructions “Use the area tool” signify you should use this tool.

Labeling tool - This tool can be used to label certain elements in graphs such as curves, lines, and shapes. In questions, the instructions “Use the labeling tool” signify you should use this tool.

Undo - If you want to remove work by the last tool you used (a single point or a complete curve), or change your mind about the placement of a curve you’ve shifted, click the undo button. If you shift a curve and then change your mind and shift it somewhere else using the drag button rather than the undo button, your answer may be marked incorrect.

Redo - If you want to redo the work you’ve just undone, click on the redo button.
 Reset - If you want to reset the graph and start from scratch, click on the reset button.
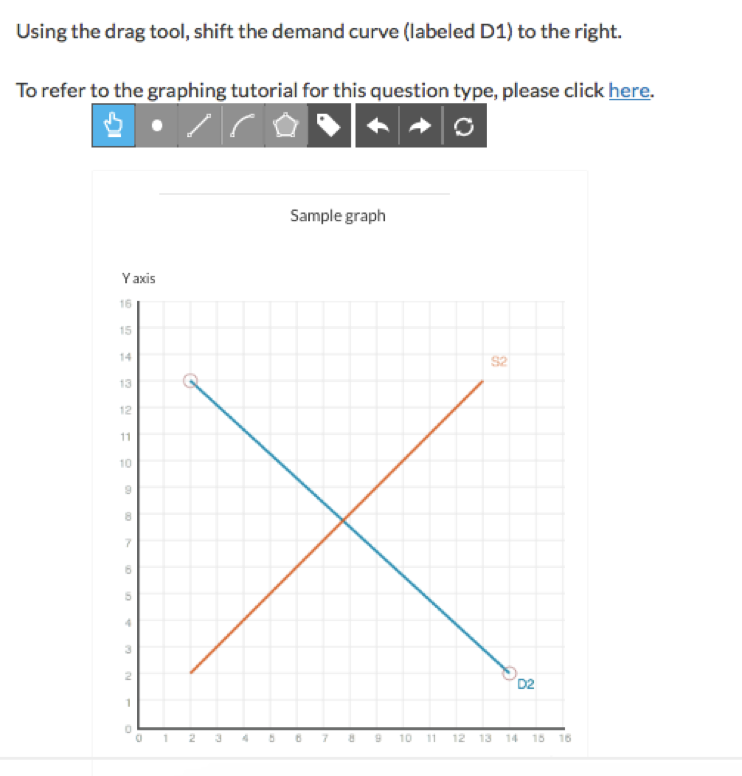
Tutorial 1: Shifting a curve
To view a video walk-through of this tutorial, click here.
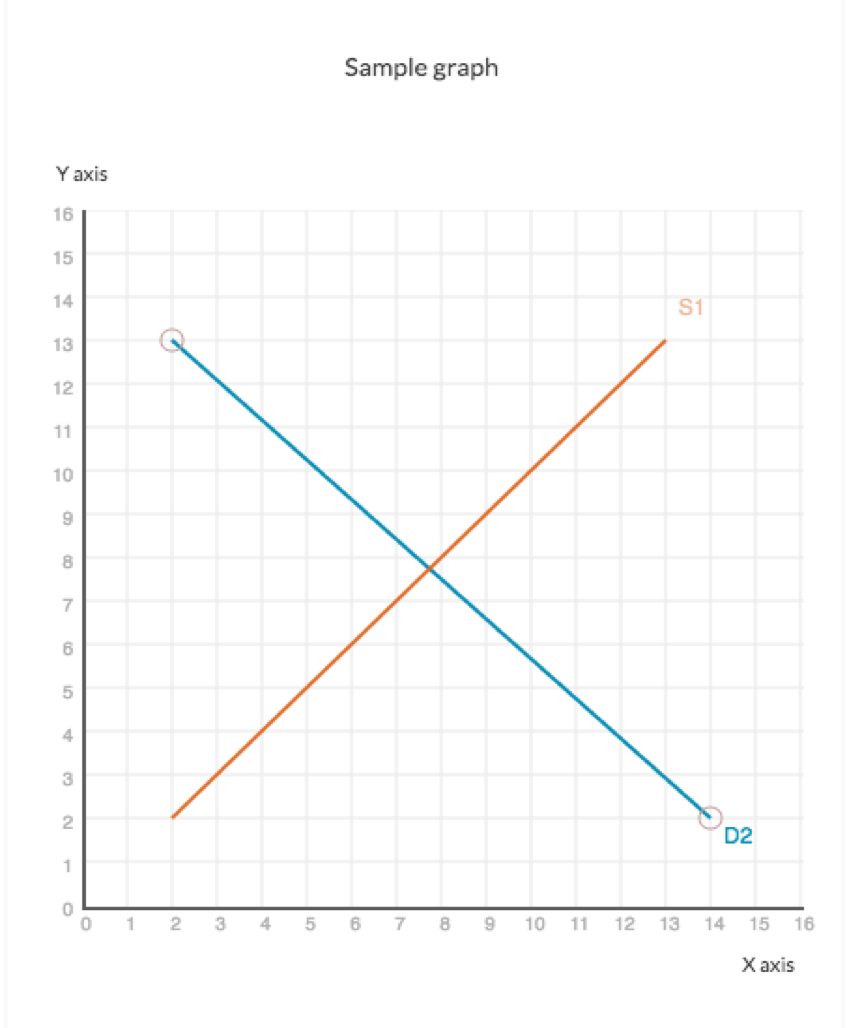
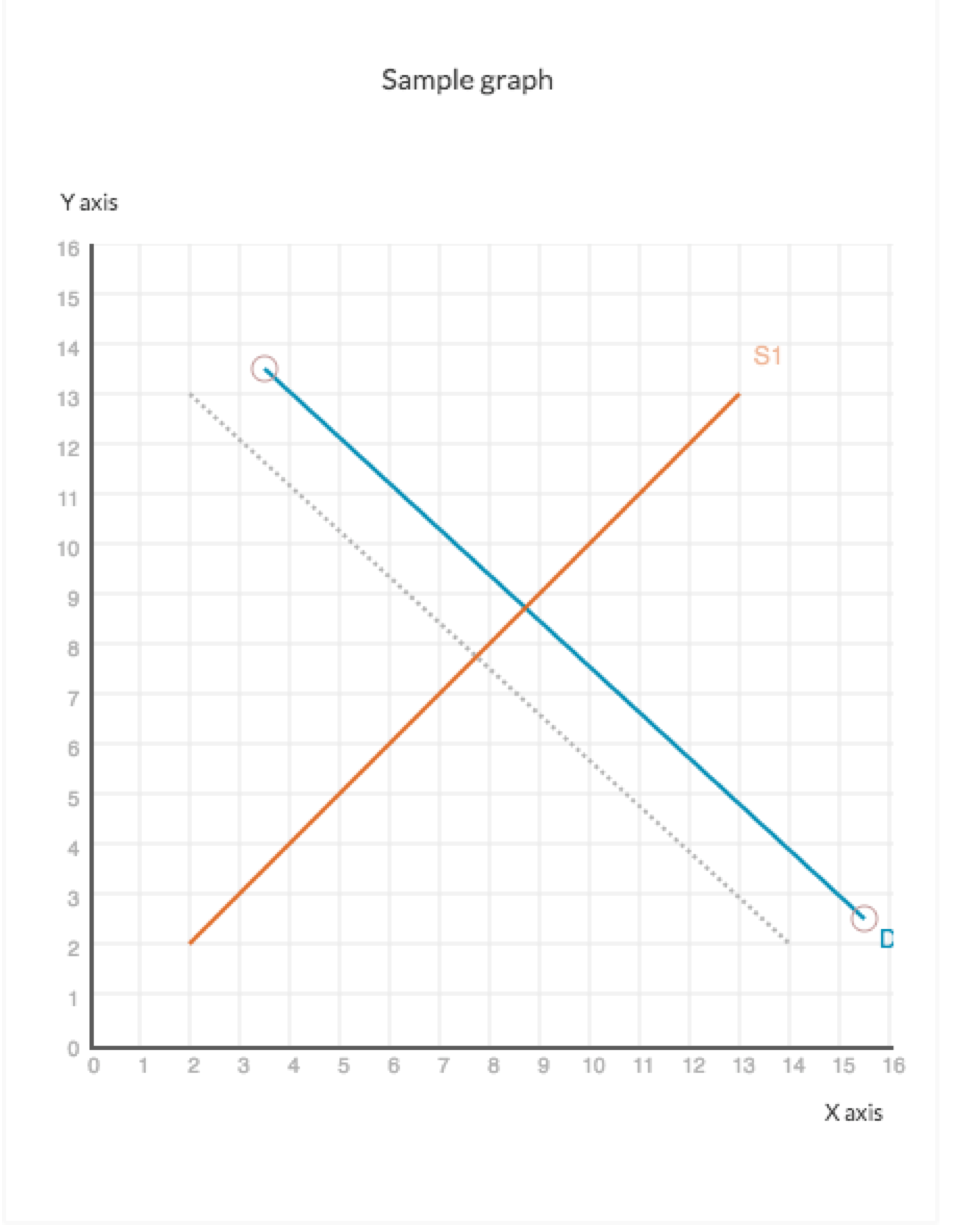
To shift a curve, click on the drag tool and then click on the curve you’d like to shift. The curve you’ve selected will appear with its endpoints circled:
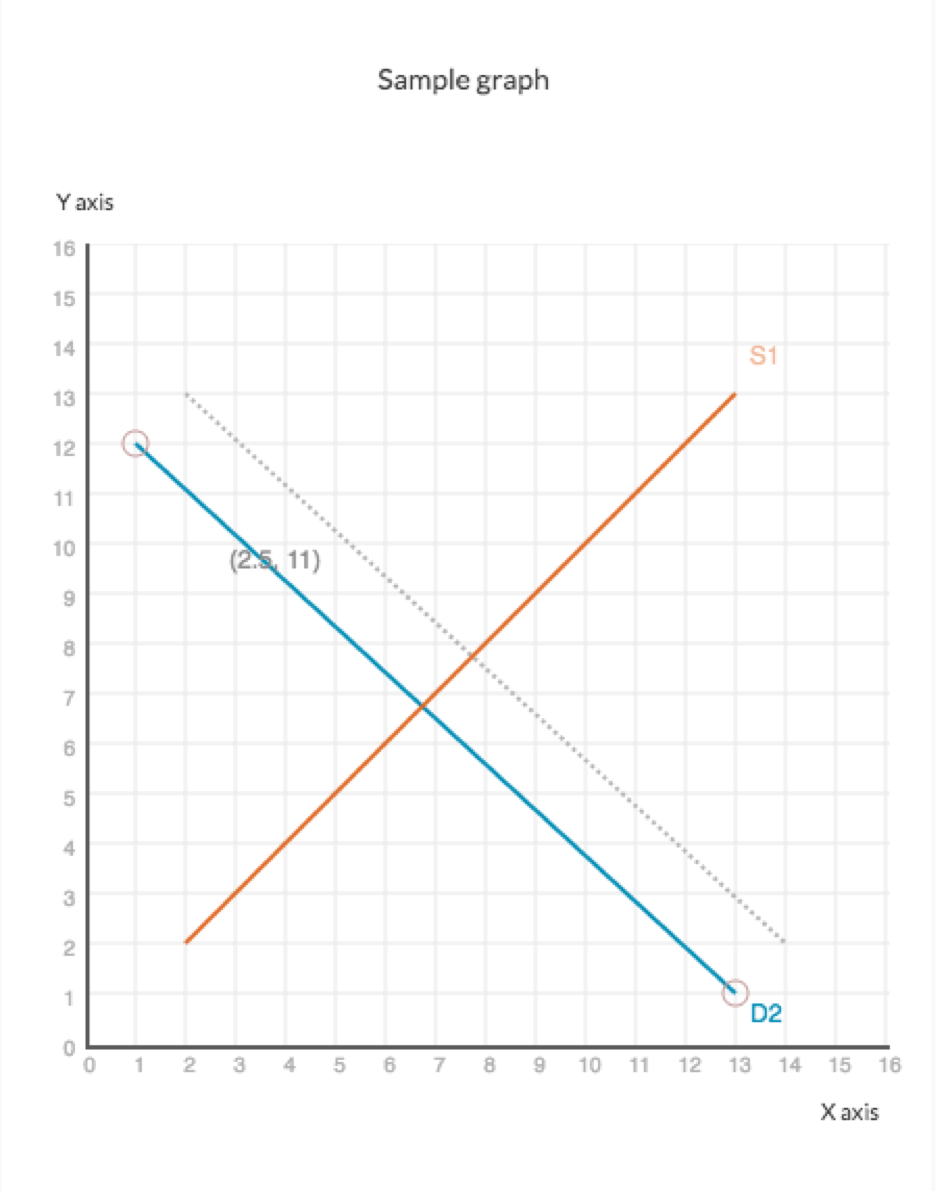
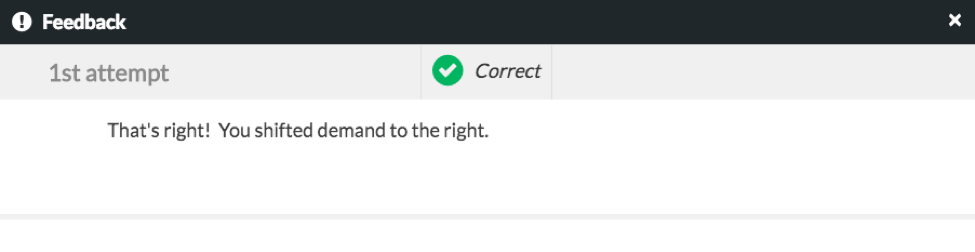
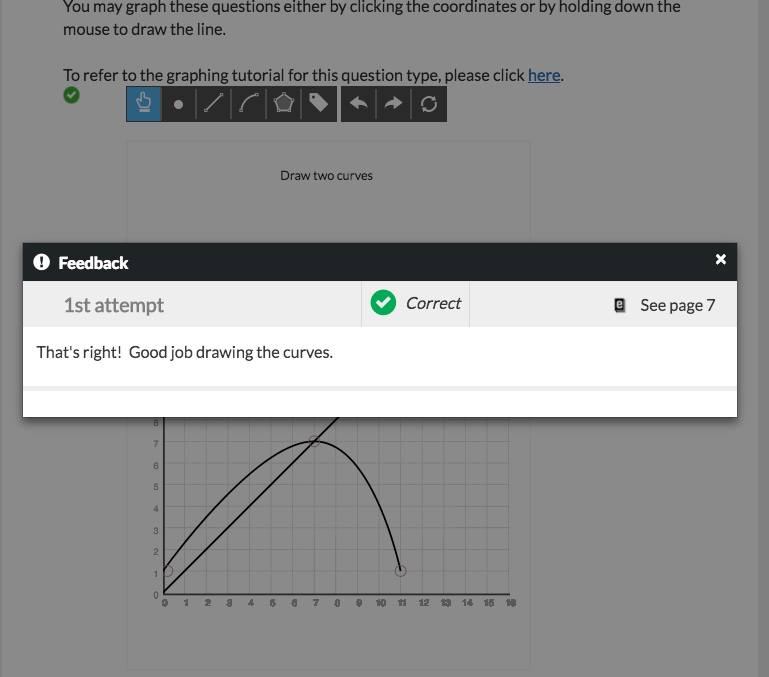
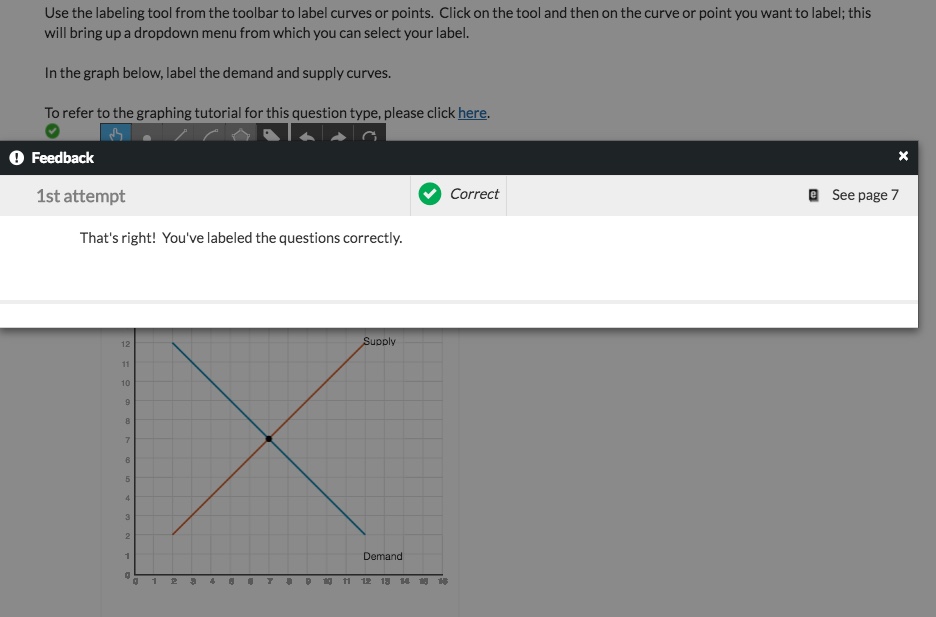
Holding onto the curve, shift by moving it to the appropriate location or area. After you’ve placed your curve, click the “Submit Answer” button in the bottom-right of your screen. If you answer the question incorrectly, you’ll receive feedback to that effect:
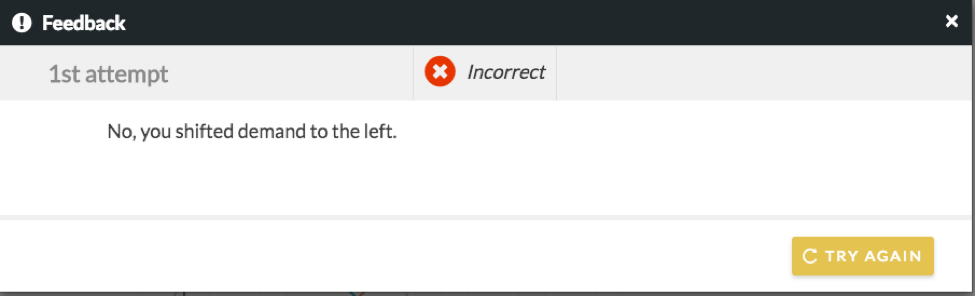
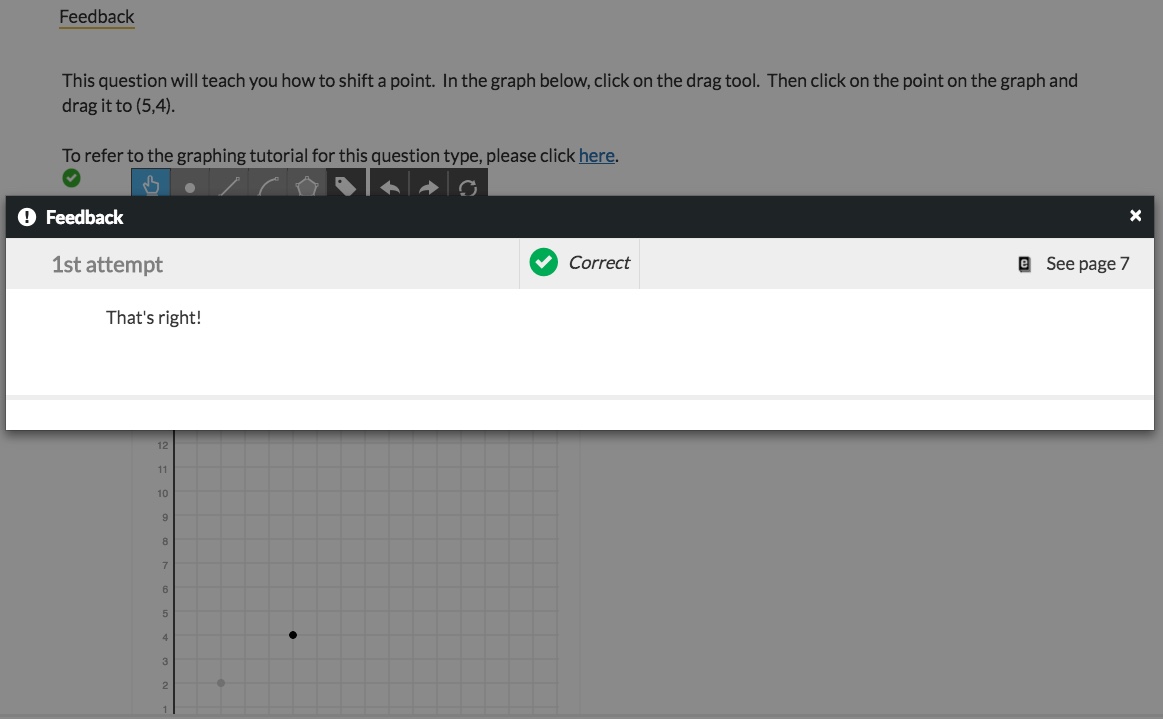
Click “Try again” and you can retry the question (assuming your instructor has enabled this feature). Scroll to the top of the page to access your new attempt. If you answer the question correctly, you’ll receive feedback to that effect:
Additionally, some questions will require that you drag the curve or point to a general area, while others will require that you drag it to a specific area. The process is identical for each approach. If you move the wrong curve or move a curve to the wrong place, click the undo or reset button to return the curve back to its origin, and then proceed to answer the question correctly.
Tutorial 3: Moving a Point
To view a video walk-through of this tutorial, click here.
Questions may ask you to move a point or curve to a general area (i.e. “Move the point to the area on the graph where demand is increased and supply is decreased”), or to a specific location. Moving an element to a general area is covered in Tutorial 1; this lesson deals with shifting a point to a specific location. The same logic applies to shifting a curve to a specific location.
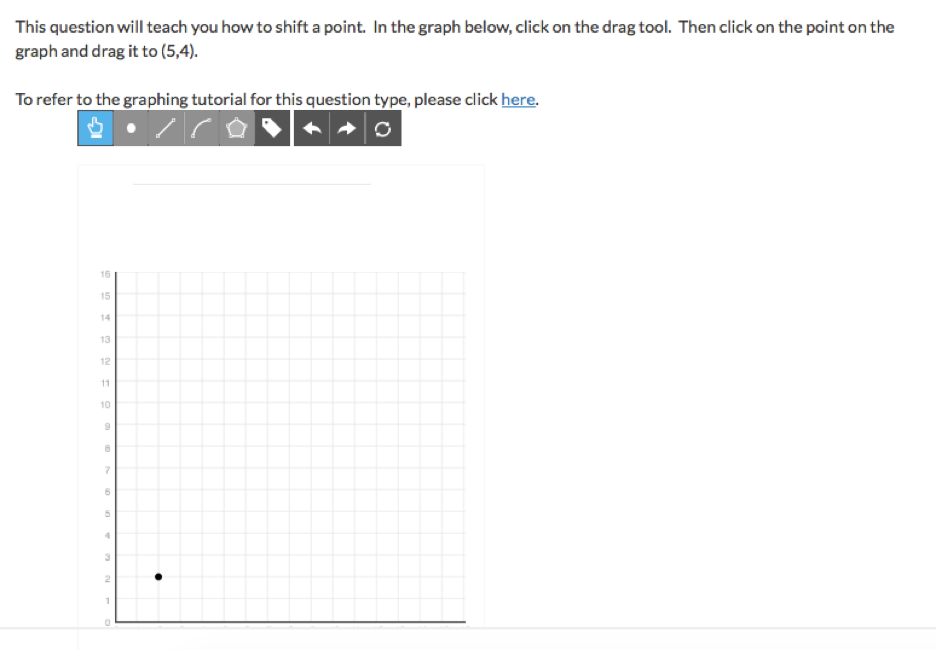
To move a point to a specific location, first click on the drag tool in your toolbar. Then click on the point and, holding down your mouse, drag it to the new location:
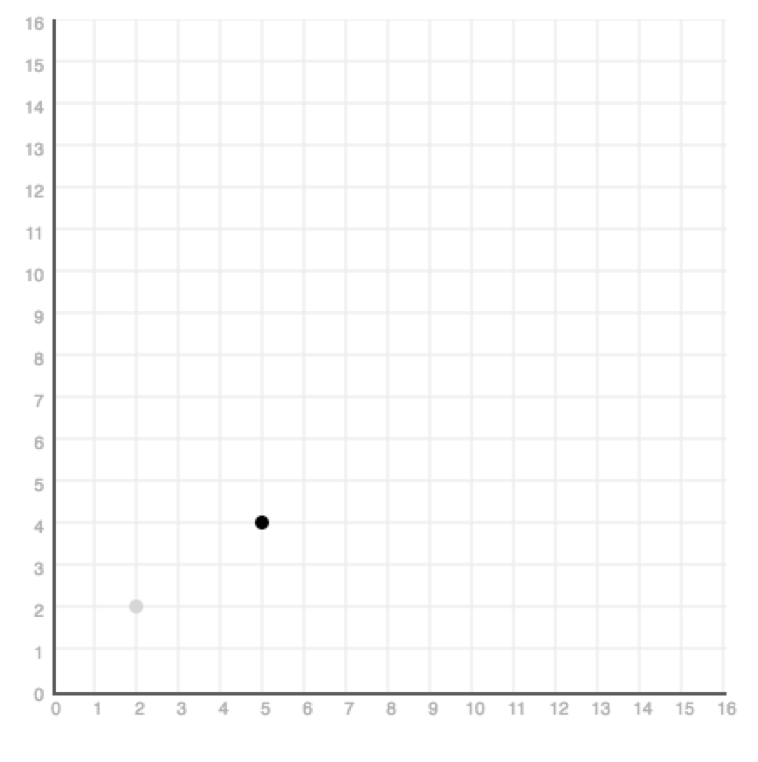
When the point is where you want it, click the "Submit" button:
Tutorial 4: Shifting a horizontal line
To view a video walk-through of this tutorial, click here.
Some questions (typically, those where you are expected to find an equilibrium) will ask you to shift a horizontal line.
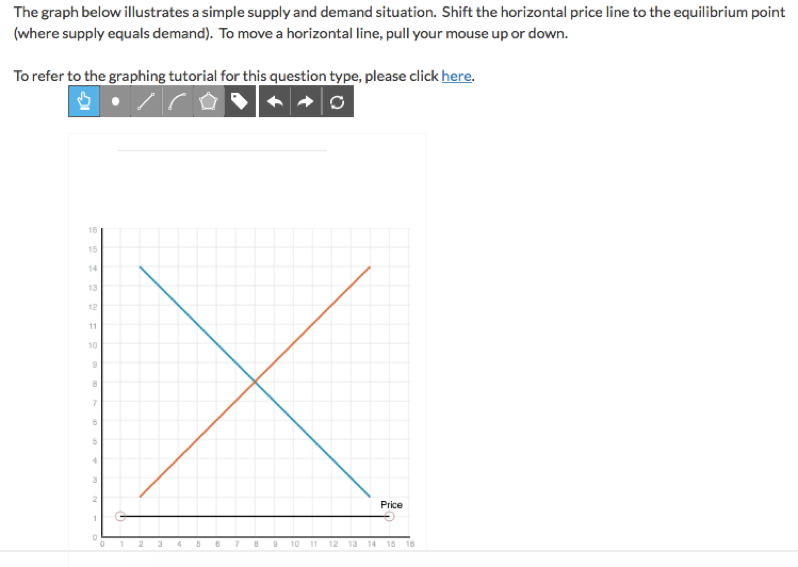
To shift a horizontal line, you will use the drag tool to click on the line. While holding onto the line with your mouse, pull your mouse down to shift down or up to shift up. Place your line in the desired location:
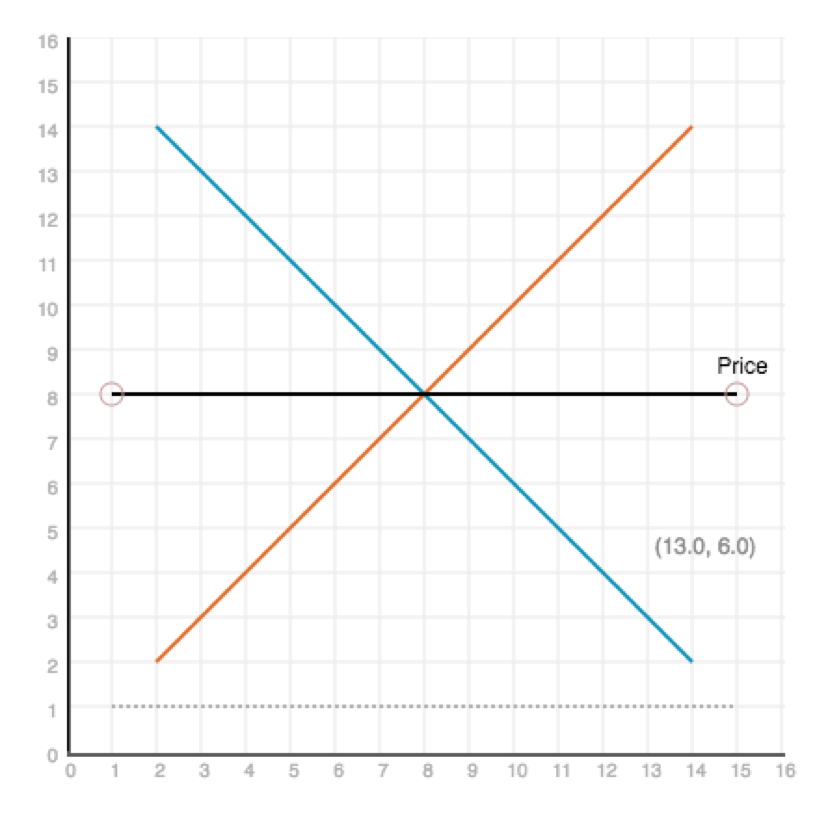
When you are satisfied with your answer, click "Submit."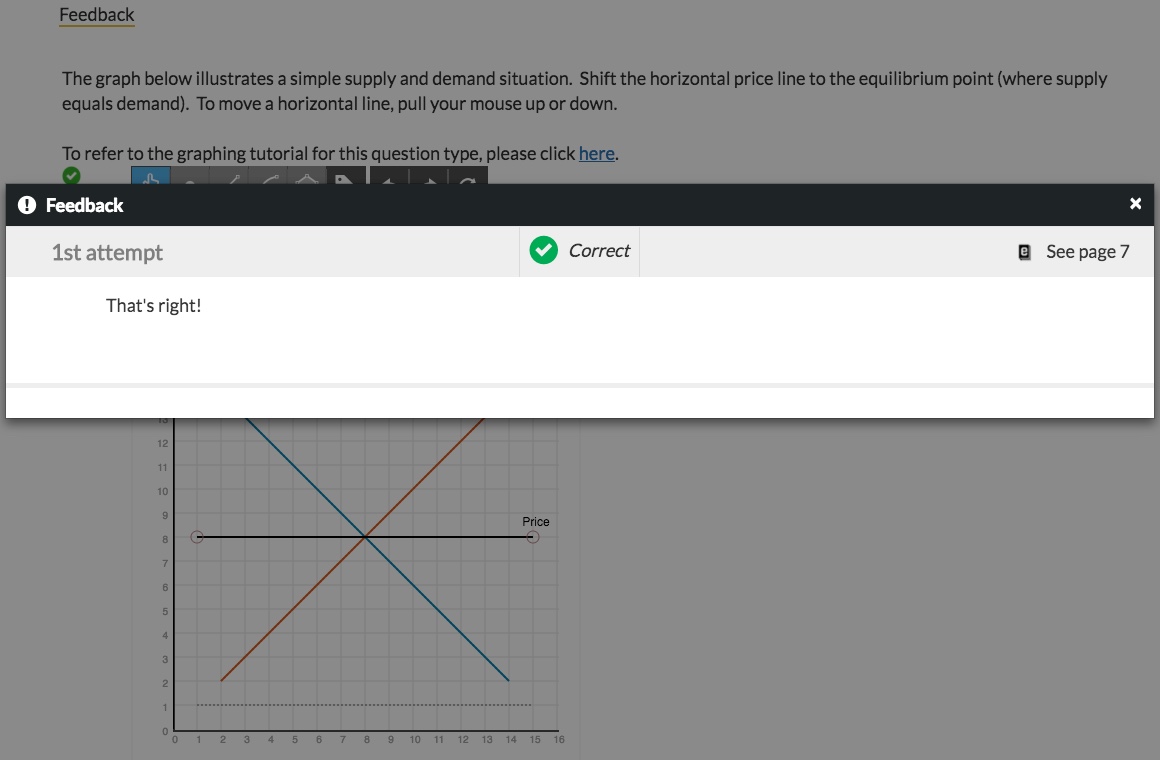
Tutorial 5: Drawing a curve
To view a video walk-through of this tutorial, click here.
Some questions will ask you to draw a curve, using either the straight-line tool or the curved-line tool. To do this, you must first select the tool, which will be indicated in the question and will be accessible in the tool bar.
In the sample question below, the graph initially appears blank because you have not yet drawn the curve:
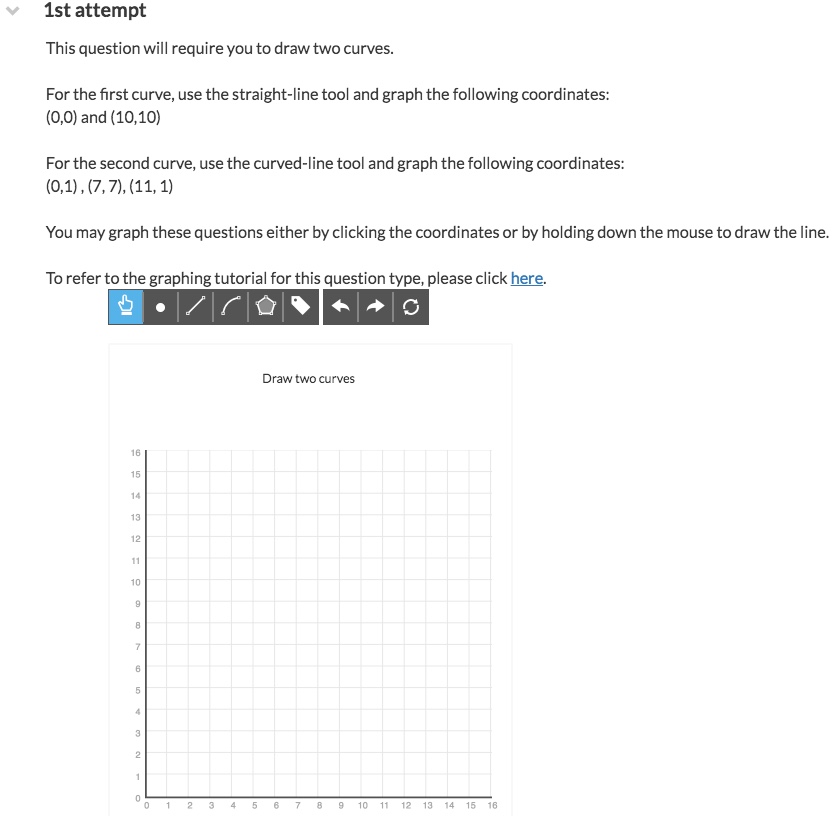
You can draw a curve in one of two ways: either you can click on the appropriate endpoints and the curve will draw itself automatically, or you can hold down your mouse (or finger or stylus, on a tablet) and trace the line as you would on paper. In this case, the curve will snap into place as you free-hand draw. Both ways will work for each question.
To draw a curve using the straight-line tool, first click on the straight-line tool in the toolbar. Then click on the graph, and either click on the endpoints or hold down the mouse to draw the line:
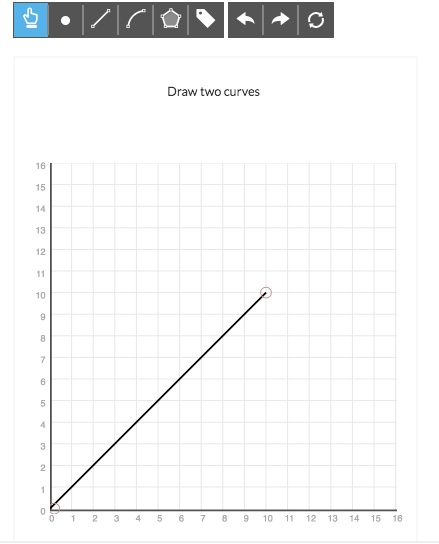
If you need to draw multiple curve segments or lines on your graph, be sure to re-select the line drawing tool each time, as it will automatically revert back to the drag tool after you draw each segment. If you draw your curve and need to reposition the points, use the drag tool to pull the points of the curve where you want them to be.
To draw a curve using the curved-line tool, first click on the curved-line tool in the toolbar. Then click on the graph, and either click on the endpoints and midpoint or hold down the mouse to draw the line. While both methods work for drawing a curve, you may find it easier simply to click the points:
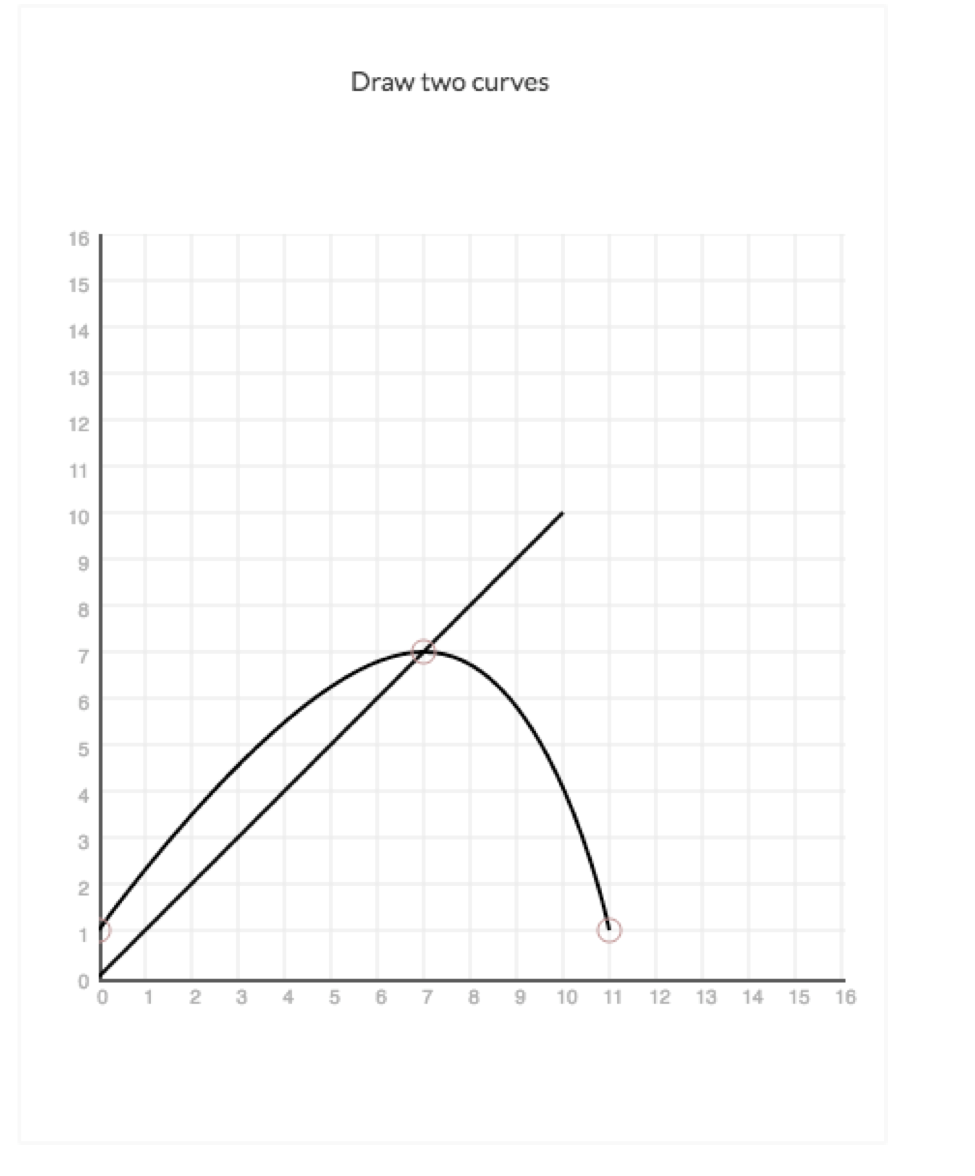
When you have placed the curves where you want them, click "Submit."
Tutorial 6 (a & b): Drawing a shape and shading an area
To view a video walk-through of this tutorial, click here.
Some questions will ask you to draw an area, for instance, an area representing tariff profits. Others will provide you with coordinates to plot.
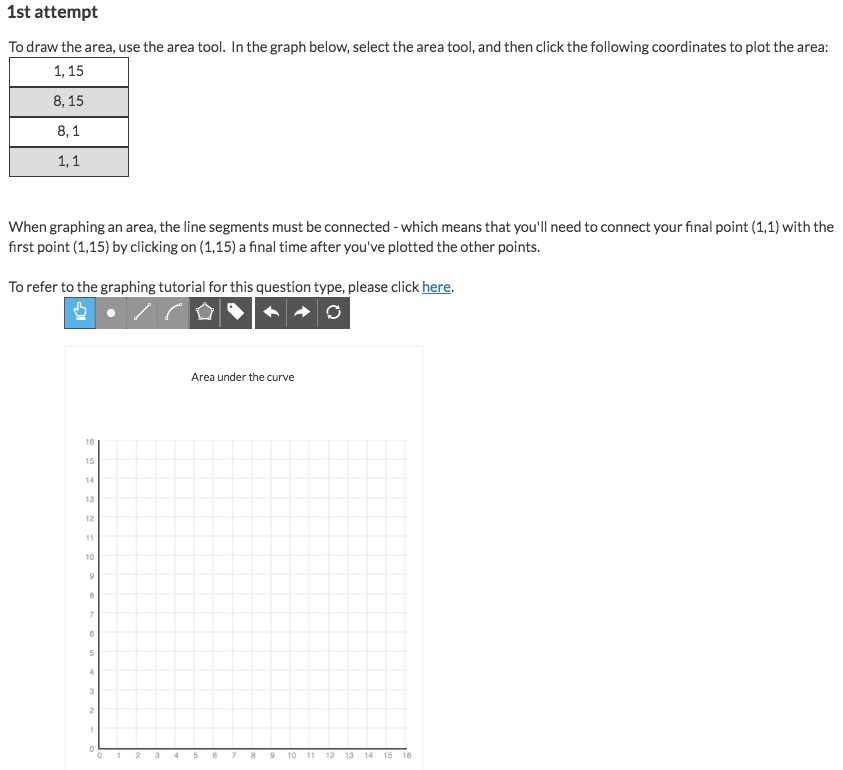
If the shape appears hollow, as below, you have not connected all your points for the area.
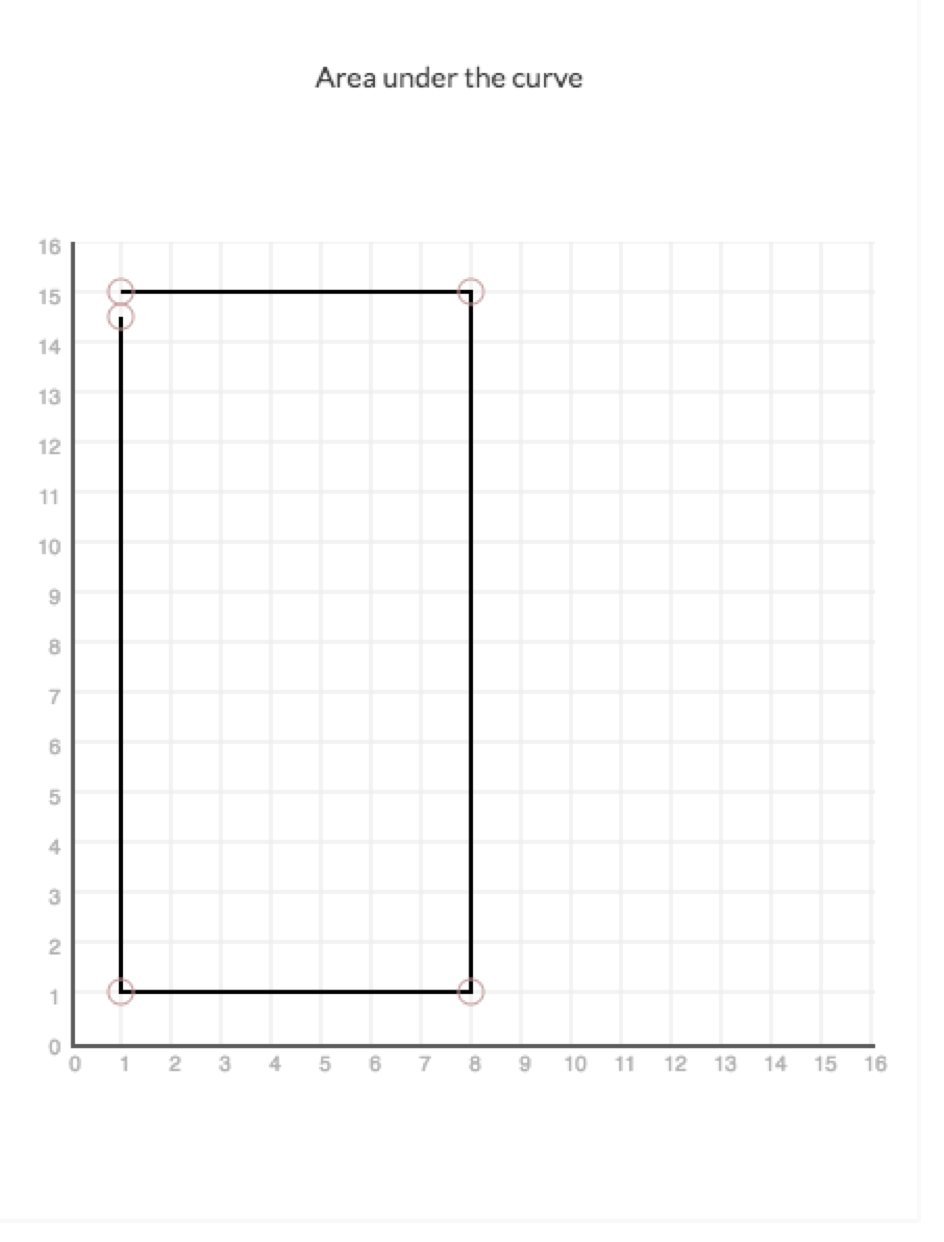
You will know you have completed your area when the shape turns black.
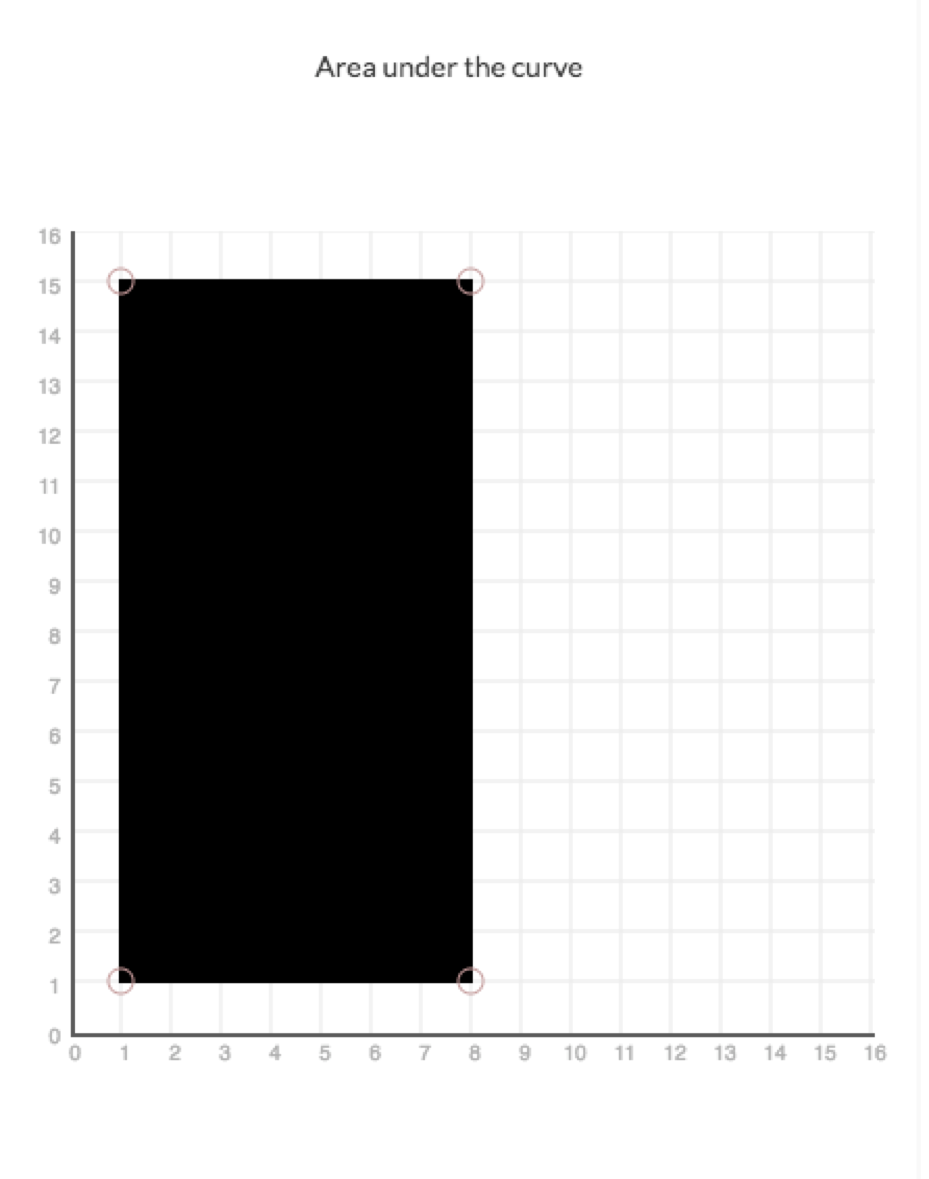
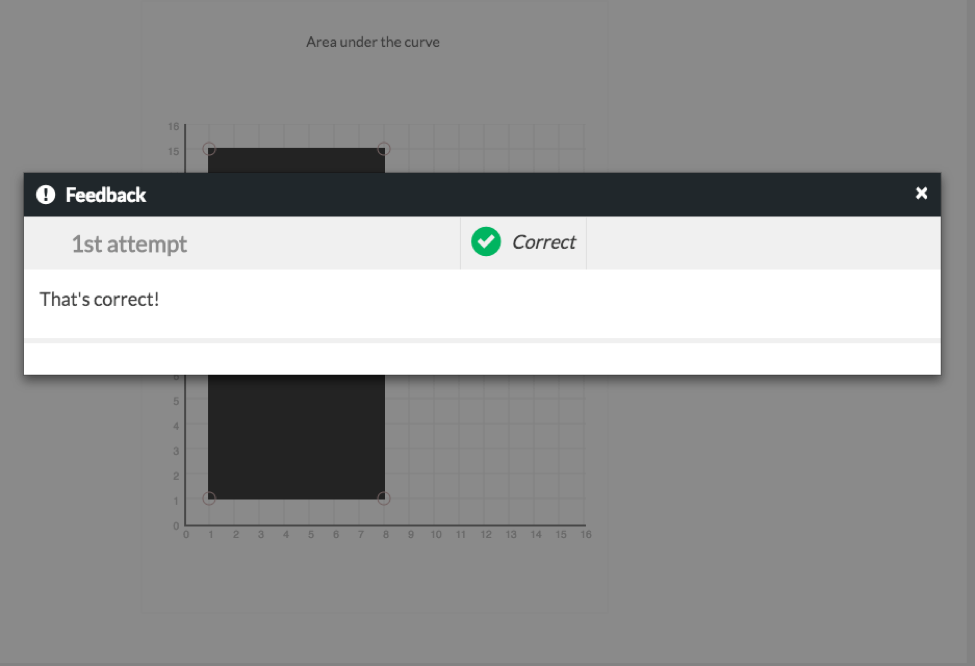
When you have completed the area, click “Submit.”
Tutorial 7: Labeling curves and points
To view a video walk-through of this tutorial, click here.
Some questions will ask you to label a curve or point. To do this, first select the label icon from the toolbar. Next, click on the curve or point you want to label:
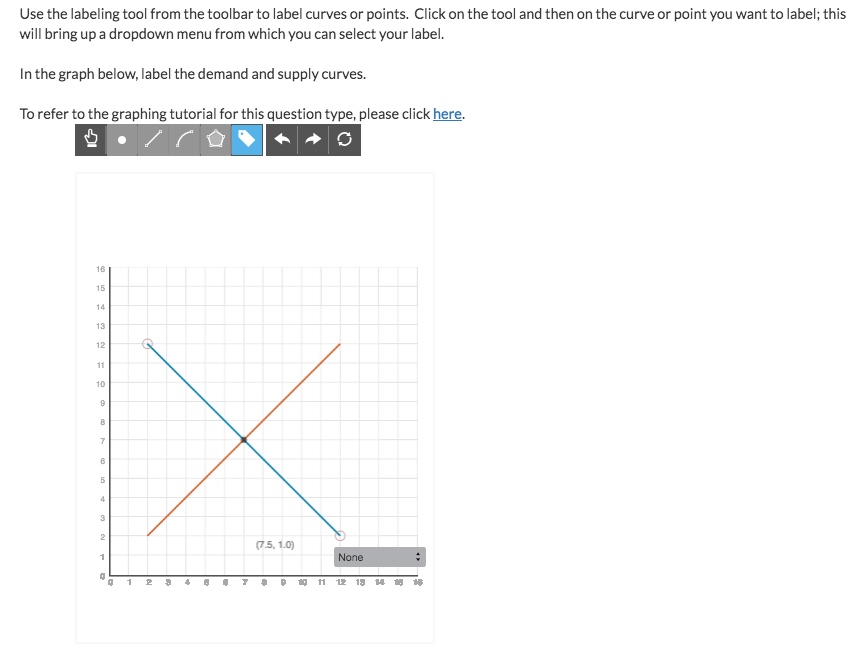
This will bring up a dropdown menu of possible labels. Click on the correct label for your curve or point:
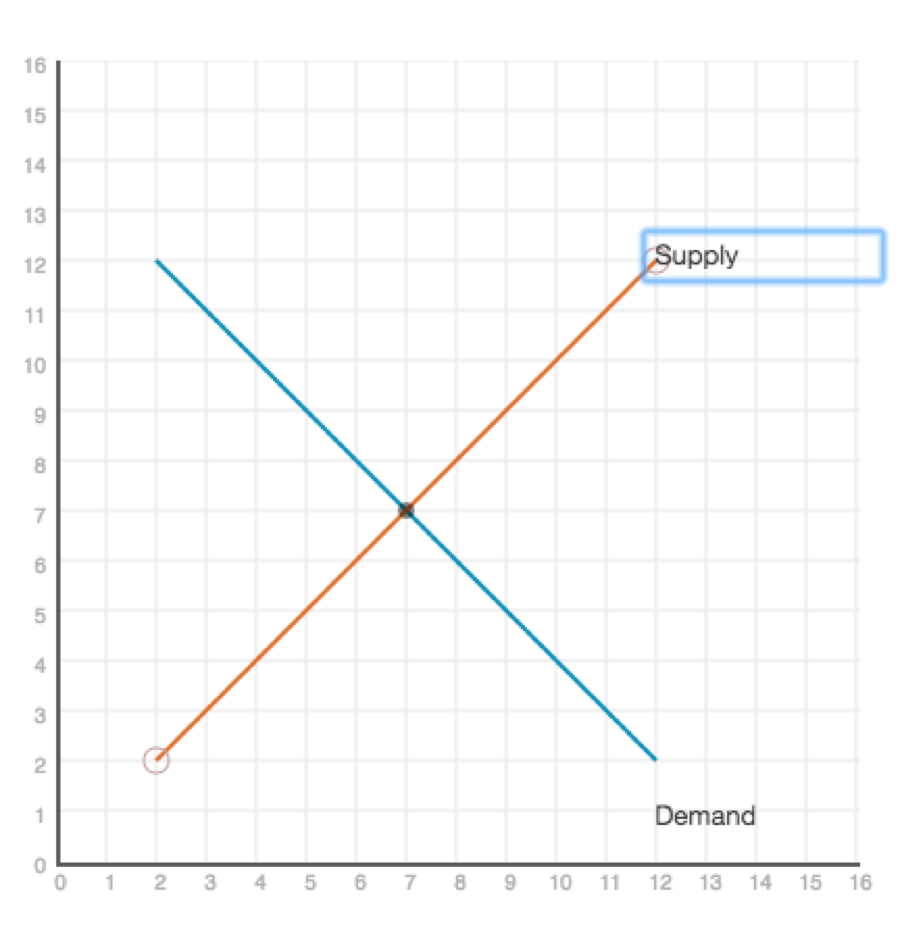
When you have labeled all the necessary curves or points, click “Submit.”
Drawing Errors
An error warning will be displayed on the graph if two overlapping lines are drawn or if a line is drawn along the x or y axis. To dismiss this error, click the reset button to redraw your graph.
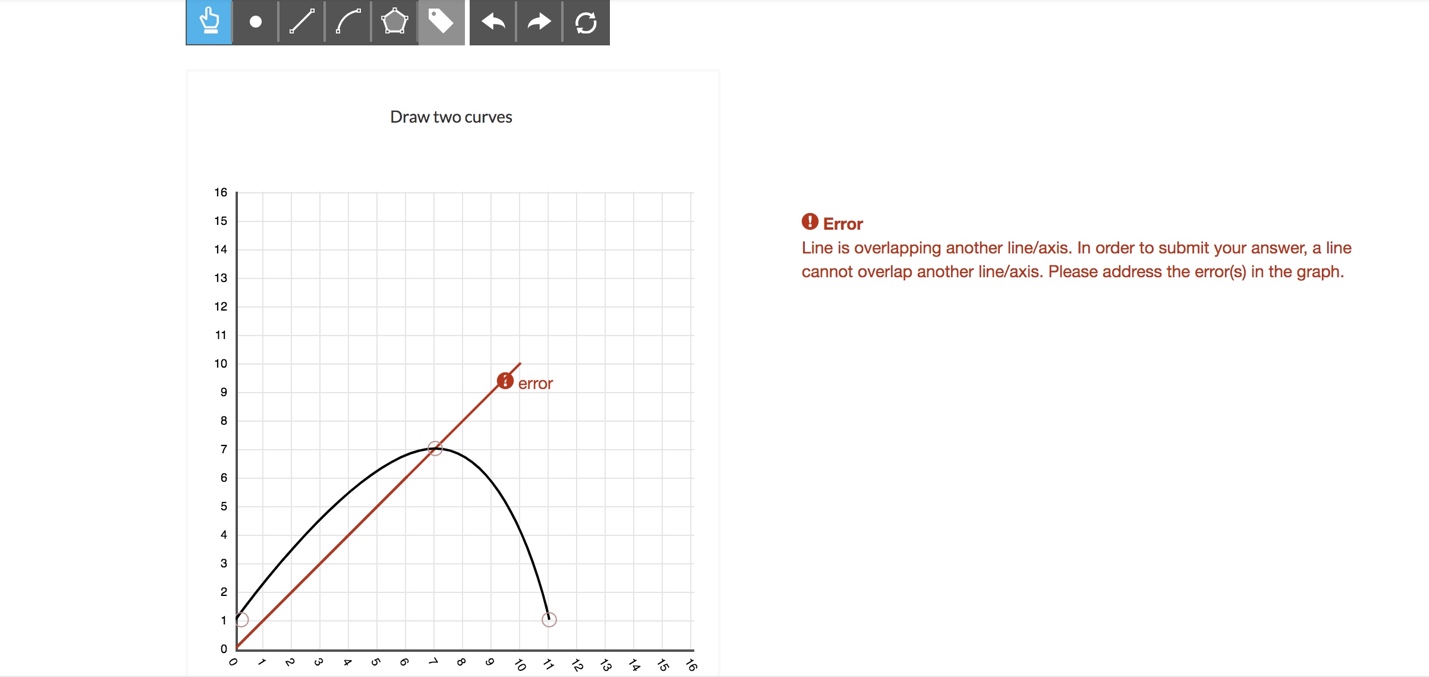 Example of two overlapping lines drawn
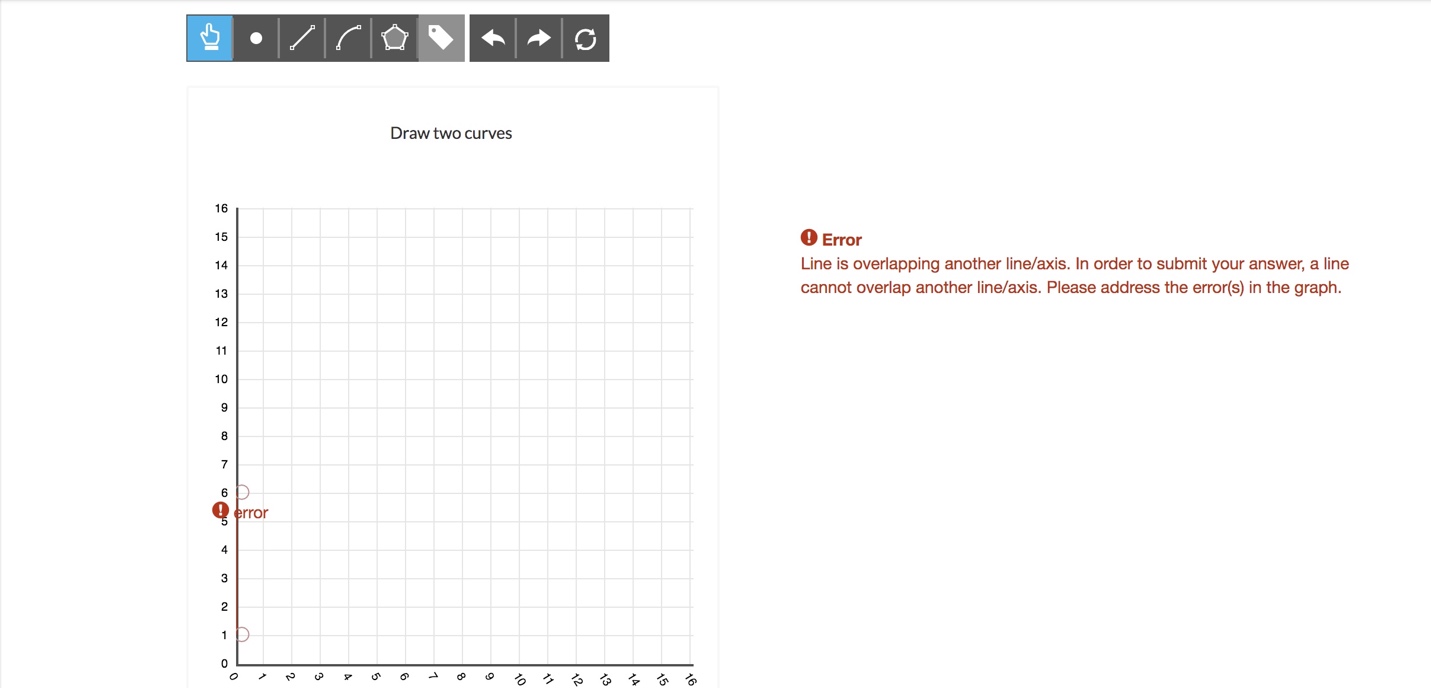 Example of a line drawn along the y-axis
Submit a Support Request
Still need help? Submit a support ticket and a customer support specialist will be happy to assist you.
Opened a request already? Click here for an update.