
Visual Guides provide illustrated, detailed instructions on how to use Norton Digital Toolkit products. This page presents a walkthrough of where to access the student and class activity reports provided within ZAPS 2.0 Psychology Labs.
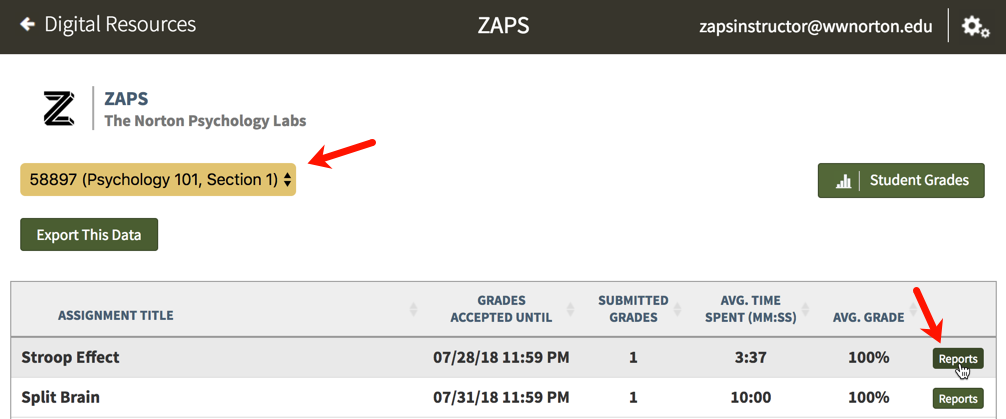
Class Activity Report
To access the Class Activity Report from the activity list, select a Student Set from the Select a Student Set dropdown menu and click the Reports button to the right of the activity for which you'd like to view the Class Activity Report.
If none of the students in the selected Student Set have attempted an activity yet, the Reports button will not be visible. To view the Class Activity Report in this case, launch an activity and select Class Activity Report from the gear menu at the top right of the page or click the Class Activity Report link on the For Instructors tab.
Student Submissions Report Tab

- You can select a new Student Set at any time.
- Click on the Manage Student Sets button to create new or edit existing Student Sets.
- The Question Responses Report tab will allow you to view or export all of the answers submitted by your students for this specific activity (see detailed information below).
- The Experience Report tab will allow you to view the aggregate class Experience data for the selected activity. Please note, not all of the activities collect class Experience data.
- Click on the Export Submissions Data button to download a .csv spreadsheet that includes all of the information displayed within the Student Submissions table at the bottom of the screen (Student Email, Student Name, Completion Date, Time Spent, and Grade).
- This search field allows you to search for information within the Student Submissions table at the bottom of the screen.
- The Student Submissions table displays the following information for each submission: Student Email, Student Name, Completion Date, Time Spent, and Grade.
- Click on the Details button to view the detailed results for individual students (see detailed information below).
- Click on the Done button to close this window.
Details Button

- Click the Export Submission Data button to download a .csv spreadsheet that includes all of the information displayed in the table at the bottom of the screen.
- In the chart on the left side of the screen, you can see the Completion Date, Grade, and Time Spent for this student's submission. If you have overridden a students grade, you will see two grade categories; Submitted and Current. The Current Grade category is the grade earned by the student. The Submitted Grade category is the grade that is reported to the student's Launch Page grade and/or an LMS gradebook.
- Click on the Reset Submission button to erase this student's submission data. Please be careful as this operation cannot be undone!
- Click on the Override Grade button to change this student's grade. For example, if a student's responses to the free-response questions were not correct, you can override their grade to reflect those incorrect responses. If you have overridden a student's grade, you will see a small dagger next to the Current Grade (the grade the student originally earned after completing the activity) and the detailed message to the right of the grades.
- This search field allows you to search for information within the table at the bottom of the screen.
- This table displays all of the student's answers to the questions presented throughout the activity. Each column is sortable so click on the column's header to sort the information based on that category, either ascending or descending.
- Click on the All Question Responses button to view all of the responses to this specific question submitted by all members of the selected student set.
- Once finished, click on the Done button to return to the Class Settings and Reports page.
Question Responses Report Tab

- You can select a new Student Set at any time.
- Click on the Manage Student Sets button to create new or edit existing Student Sets.
- Click on the Export Question Data button to download a .csv spreadsheet that includes all of the information displayed in the table at the bottom of the screen.
- This search field allows you to search for information within the table at the bottom of the screen.
- This table displays all of the answers to the questions presented throughout the activity by all students in the selected Student Set. Each column is sortable so click on the column's header to sort the information based on that category, either ascending or descending.
- Click on the Details button to view Questions Response Details page for the selected question (see detailed information below).
- Click on the Done button to close this window.
Details Button
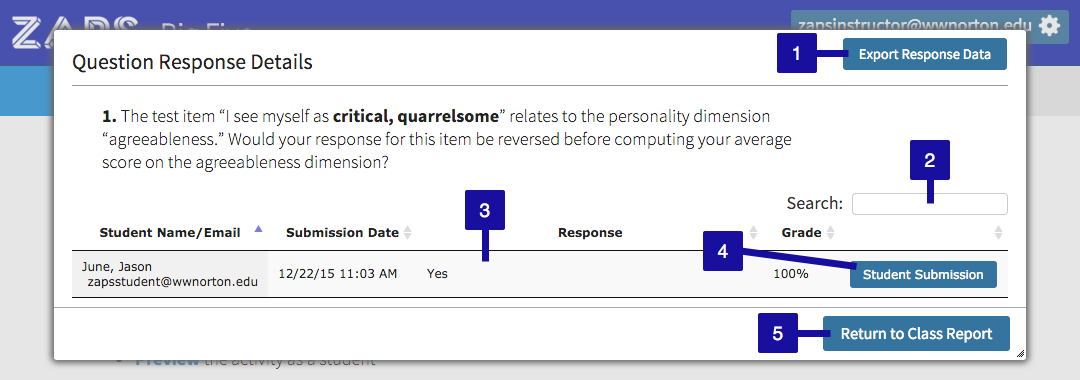
- Click on the Export Response Data button to download a .csv spreadsheet that includes all of the information displayed in the table at the bottom of the screen.
- This search field allows you to search for information within the table at the bottom of the screen.
- This table displays all of the answers to this specific question by all students in the selected Student Set. Each column is sortable so click on the column's header to sort the information based on that category, either ascending or descending.
- Click on the Student Submission button to view the submission details for the selected student.
- Once finished, click on the Return to Class Report button to return to the main Class Activity Report page.
Experience Report Tab

- You can select a new Student Set at any time.
- Click on the Manage Student Sets button to create new or edit existing Student Sets.
- Click on the Download Class Experience Subject Averages button to download a .csv spreadsheet that includes all of the average results for the students who have completed the experience in the selected Student Set.
- Click on the Download Class Experience Raw Data button to download a .csv spreadsheet that includes all of the raw data for the students who have complete the experience in the selected Student Set.
- The Graph tab will display a graph of the your results, which can be compared to the reference and class results. If you have not completed the experience yourself, sample results will be substituted for your results.
- The Table tab will display a chart that includes your results, the class results, and the reference data results.
- The Raw Data tab will display a chart of your complete trial data.
- Click on the menu icon to access the print menu. You can print or download the graph in a number of different formats.
- Your results are displayed in red. Click on the Your results link to hide or display that information on the graph.
- The class results are displayed in green. Click on the Class results (n=#) link to hide or display that information on the graph. If only one student from the Student Set has completed the experienced portion of the lab, you will not see the class results category; at least two data submissions are required to view the class results category. The (n=#) identifies how many submissions are currently included within the class results (ex. n=2 means that the class results data is made up of 2 submissions). Students must be enrolled in the selected Student Set for their results to be reported in the class results category.
- The reference results are displayed in blue. Click on the Reference results link to hide or display that information on the graph.
- Hover your cursor over a point in the graph to view detailed information about those results.
- Click on the Done button to close this window.
Submit a Support Request
Still need help? Submit a support ticket and a customer support specialist will be happy to assist you.
Opened a request already? Click here for an update.