
Visual Guides provide illustrated, detailed instructions on how to use Norton Digital products. This page presents a walkthrough of where to access and review the student activity reports for activities that you assign in InQuizitive.
During an Activity

- If your instructor has set a Grades Accepted Until (GAU) date for the activity, it will appear here.
- This sentence reveals the number of questions you need to answer to receive a grade for this activity.
- This sentence displays your current score for this activity.
- This sentence displays your current level for this activity.
- This sentence reveals how many points you need to earn to make it to the next level in this activity.
- This sentence reveals how many points you need to earn to reach the Target Score for this activity.
- This line graph plots all of the questions you have answered throughout this activity (discussed below).
- This chart will show the Learning Objectives covered in this activity.
- The Performance column will display your performance for each learning objective covered in this activity. The longer the bar, the better you have performed in relation to that objective.
- The buttons to the far right in each learning objective row will display the textbook pages on which that specific learning objective is discussed. If you have access to the ebook, the ebook will open to those pages when clicking the button.
- Click on the Take a Break button to take a break from answering questions.
- Click on the Back to Questions button to return to the activity and resume answering questions.
Line Graph
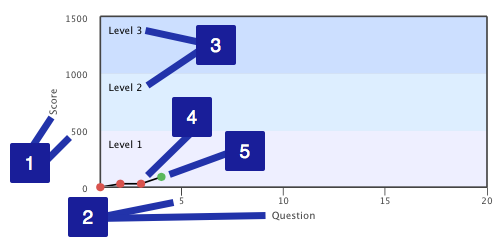
- The y-axis displays your cumulative score.
- The x-axis displays the number of questions you have answered.
- Each level of the activity is identified with shaded horizontal bars.
- Questions you answer incorrectly will be plotted as red dots.
- Questions you answer correctly will be plotted as green dots.

To view detailed information about each question, hover your cursor over each dot on the line graph and a detail box will appear. If you would like to review the entire question again, click on the dot and you will proceed directly to that question within the activity.
After Completing an Activity

- If the Grades Accepted Until (GAU) date has changed to red, the GAU date has passed and you can no longer submit or improve your grade. If the date is black, the GAU date has not yet passed and you can submit or improve your grade until you reach 100%. After the GAU has passed, you'll be able to continue to answer questions for review purposes but you won't be able to improve your grade.
- After completing the activity, your grade will be displayed within this sentence. You can improve your grade until the GAU date passes or you reach 100%.
- This sentence displays your current score. You can improve your score until the GAU date passes.
- All of the questions you answered throughout the course of the activity will be plotted on the line graph. Green dots signify questions you answered correctly while red dots signify questions you answered incorrectly.
- The learning objectives covered within this activity are displayed in this chart. After you have answered the minimum number of questions in the activity, you can choose which objectives you'd like to keep working on. Click on the check box to the left of each objective to select or deselect each learning objective.
- The Performance column will display your performance for each of the learning objectives covered in this activity. The longer the bar, the better you have performed in relation to that learning objective.
- Click on the Take a Break button to take a break from answering questions.
- Click on the Back to Questions button to return to the activity and resume answering questions.
Submit a Support Request
Still need help? Submit a support ticket and a customer support specialist will be happy to assist you.
Opened a request already? Click here for an update.