
Visual Guides provide illustrated, detailed instructions on how to use Norton Digital products. This page presents a walkthrough of where to access and review the class activity reports for assignments that you assign in InQuizitive.
Accessing from the Assignment List
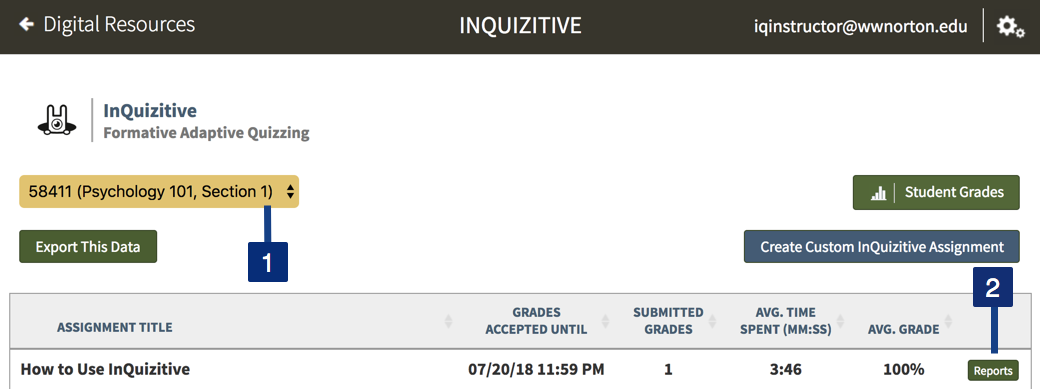
- To view the Class Activity Report for an assignment, select a Student Set from the Select a Student Set drop-down menu.
- Click on the Reports button to the far right in the same row as the assignment title. The Reports button will only appear next to assignments where at least one student in the selected Student Set has begun working on that specific assignment. If no students in the selected Student Set have begun the assignment yet and the Reports button is not visible, follow the directions in the next section, Accessing from Within an Assignment, to access the Class Activity Report.
Accessing Within an Assignment
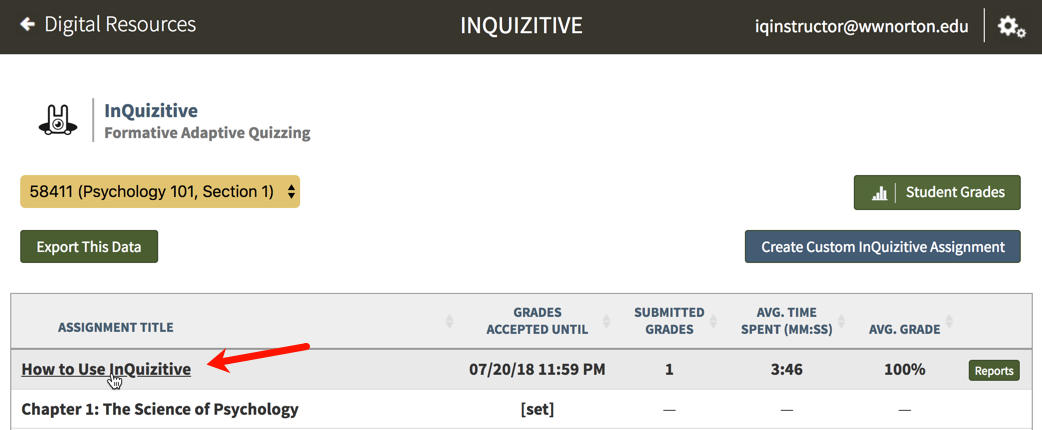
On the Assignment List, click on the assignment title to launch the assignment.
Once on the Instructor Activity Introduction for the selected assignment, click on the gear icon in the upper-right corner and select Class Activity Report from the menu.

Students Tab

- Click on the gear icon to access the activity tools.
- Click on the Learning Objectives/Questions tab to view the Learning Objectives/Questions information.
- You can select Student Sets at any time.
- Click on the Export Report Data button to download a .csv Excel file of the information in the table at the bottom of the screen.
- The mean statistics for this assignment will be displayed in this chart. You can click on the blue links (Questions Answered, Score, Submitted Grade, & Time Spent) in the list to load those statistics into the histogram on the right side of the screen. The histogram of submitted grades will be displayed by default.
- By default, this histogram displays the grades submitted by students within the selected Student Set. The y-axis displays the number of submitted activities while the x-axis displays the grade range. Other information can be loaded into the histogram by clicking the blue links in the box to the left of the graph (Questions Answered, Score, Submitted Grade, & Time Spent).
- Click the menu icon to access the print menu. You can print or save the histogram in a number of different formats.
- Hover your cursor over a bar in the histogram to view detailed information.
- If you have set a Grades Accepted Until (GAU) date for the selected assignment, it will be displayed here. GAUs that have not yet passed will be displayed as black text while GAUs that have passed will be displayed as red text.
- You can use the search feature to search for any information presented in the table at the bottom of the screen.
- The grade table displays student email addresses, names, submission dates, the number of questions answered in each submission, time spent completing each assignment, scores, and grades.
- Click on the Details button on the right side of the table to view a detailed overview of the student's submission (discussed below).
- Click the Back to Instructor Options button to return to the Instructor Activity Introduction/Instructor Options.
Details Button

- You can select Student Sets at any time.
- Click on the Export Report Data button to download a .csv Excel file of the information in the table at the bottom of the screen.
- Student specific information will be displayed in this chart.
- Click on the Override Grades Accepted Until Date to change the GAU for the selected student without changing the GAU for the entire Student Set. The new GAU will be displayed on the student's assignment list. The GAU set for the entire Student Set will still be visible on the instructor's assignment list.
- Click on the Override Grade button to manually enter a grade for a student's assignment submission. The grade will immediately update in InQuizitive. If you're using LMS integration, the grade will also immediately update in your LMS gradebook. Please note, once you override a student's grade, the grade will not change based on future question submissions by the student.
- Student specific results based on the learning objectives for this assignment will be displayed in this bar graph: the longer the bar, the better the student's performance.
- This line graph plots all of the questions answered by the student. Green dots signify correct answers while red dots signify incorrect answers.
- To view detailed information about each question, hover your cursor over each dot. Click on the dot to review the question in its entirety.
- Clicking the Reset Submission button will clear all of the selected student's data for this specific assignment. This action cannot be undone.
- Click on the Back to overall results button to return to the main Class Activity Report page.
- If you have set a GAU for this assignment, it will appear here.
- You can use the search feature to search for any information presented in the table at the bottom of the screen.
- The grade table displays student email addresses, names, submission dates, the number of questions answered in each submission, time spent completing each assignment, scores, and grades.
- Click on the Details button on the right side of the table to view a detailed overview of the student's submission.
- Click the Back to Instructor Options button to return to the Instructor Activity Introduction/Instructor Options.
Learning Objectives/Questions Tab

- You can select Student Sets at any time.
- Click the Export Report Data button to download a .csv Excel file of the information in the table at the bottom of the screen.
- The mean data for all of the questions available within the assignment will be displayed in this table.
- This scatterplot compares your students' results with the projected results for this assignment. View the legend for more information about the scatterplot. Hover over your cursor over a point in the scatterplot to view more detailed information.
- Click the menu icon to access the print menu. You can print or save the scatterplot in a number of different formats.
- Click on the Expand Scatterplot/View Legend button to enlarge the scatterplot and view the legend.
- You can use the search feature to search for any information presented in the table at the bottom of the screen.
- Click the Hide Questions button to hide or display the individual questions in the table at the bottom of the screen.
- Each learning objective is highlighted in yellow. Below each objective, all of the questions related to that specific objective will be displayed. A detailed explanation of each column can be found at the bottom of the page.
- Even if you have selected not to include a specific learning objective in the assignments for one of your student sets, all of the available questions in every learning objective will be displayed in the Question/Objective table.
- Click on the Review button to view each question in its entirety (discussed below).
- Click the Back to Instructor Options to return to the Instructor Activity Introduction/Instructor Options.
Review Button

- The number of the current question, as well as how many questions in total are available in this assignment, will be displayed.
- Even if you choose to exclude a learning objective from assignments for your student sets, all of the available questions in the entire assignment will be visible in Question Review mode.
- The complete question and answer choices will be displayed. You can also attempt to answer the question to experience the assignment yourself.
- If you feel this question is unfair or incorrect, click the Report Question button to submit a notification to the Norton editorial staff and the question will be reviewed.
- Click on the Question List button to view a list of all of the available questions within this assignment.
- Click the Previous button to go back to the previous question in the assignment.
- Click the Next button to proceed to the next question in the assignment.
- Click on the Back To Report button to return to the Class Activity Report.
Submit a Support Request
Still need help? Submit a support ticket and a customer support specialist will be happy to assist you.
Opened a request already? Click here for an update.