
As an instructor, you can view student grades for all assignments, as well as view in-depth student-specific and class-wide performance reports for each assignment.
Viewing Student Grades For All Assignments
The Student Grades Table and the Assignment List Page both give an overview of how students are doing on all assignments. Specifically, the table on the Assignment List Page displays your class’s average grade for each available assignment as well as the average time spent on each assignment. The Student Grades Table breaks this down further, giving you a report of each student’s grade for, and average time spent on, each assignment.
Student Grades Table
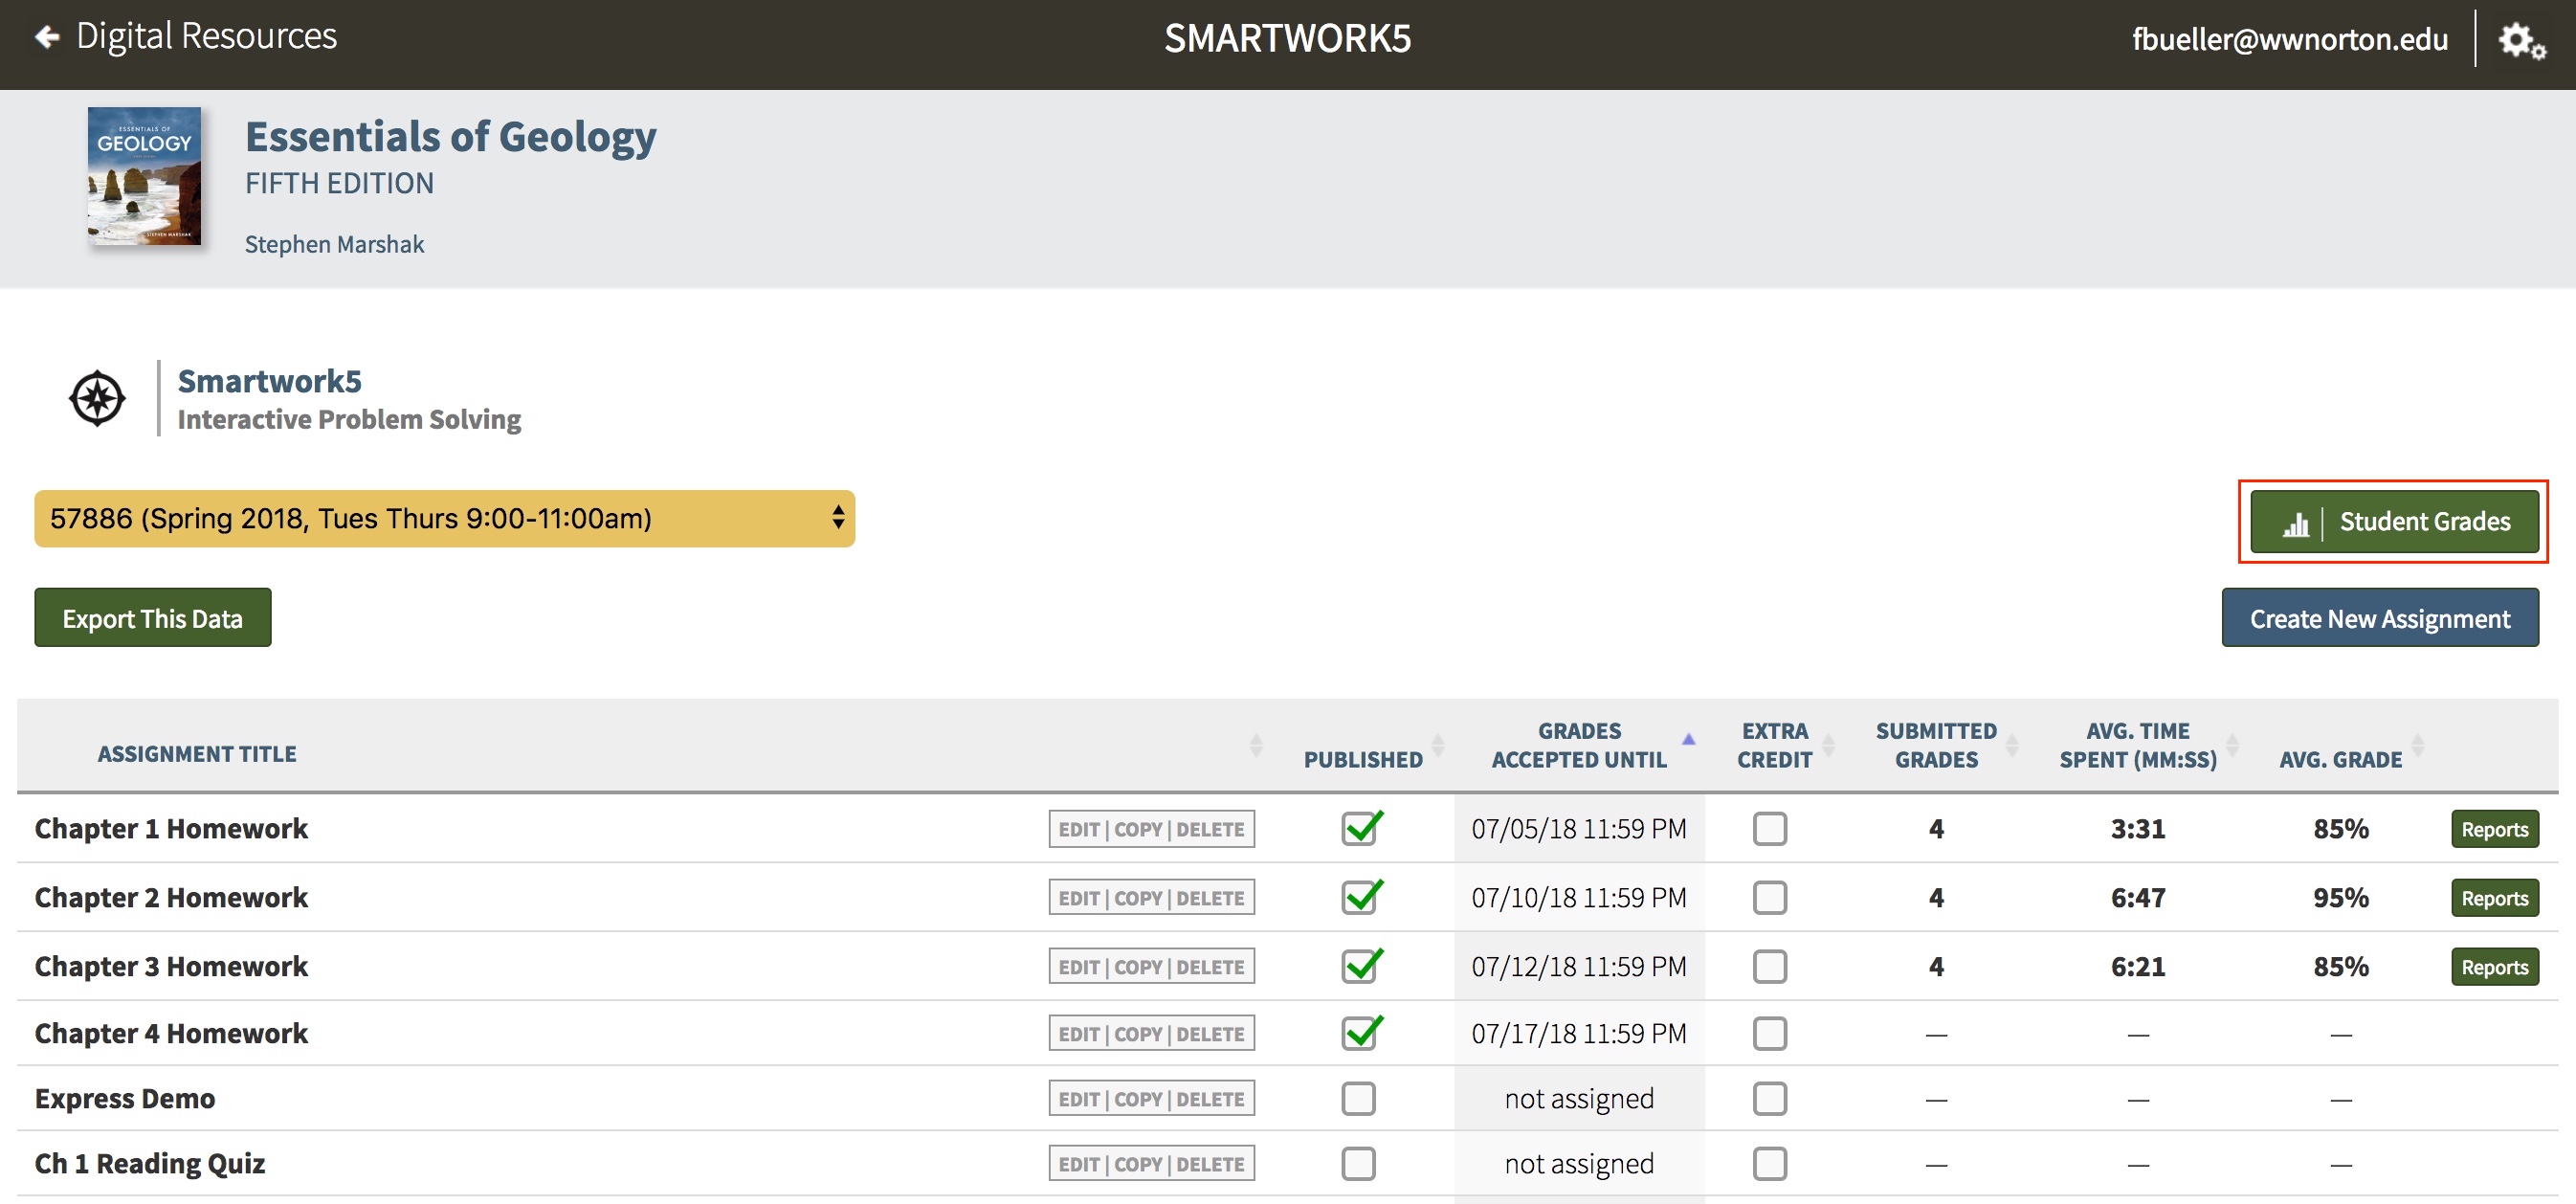
You can view results for all activities, broken down by student, by clicking on the "Student Grades" button in the upper-right corner of the Assignment List Page.
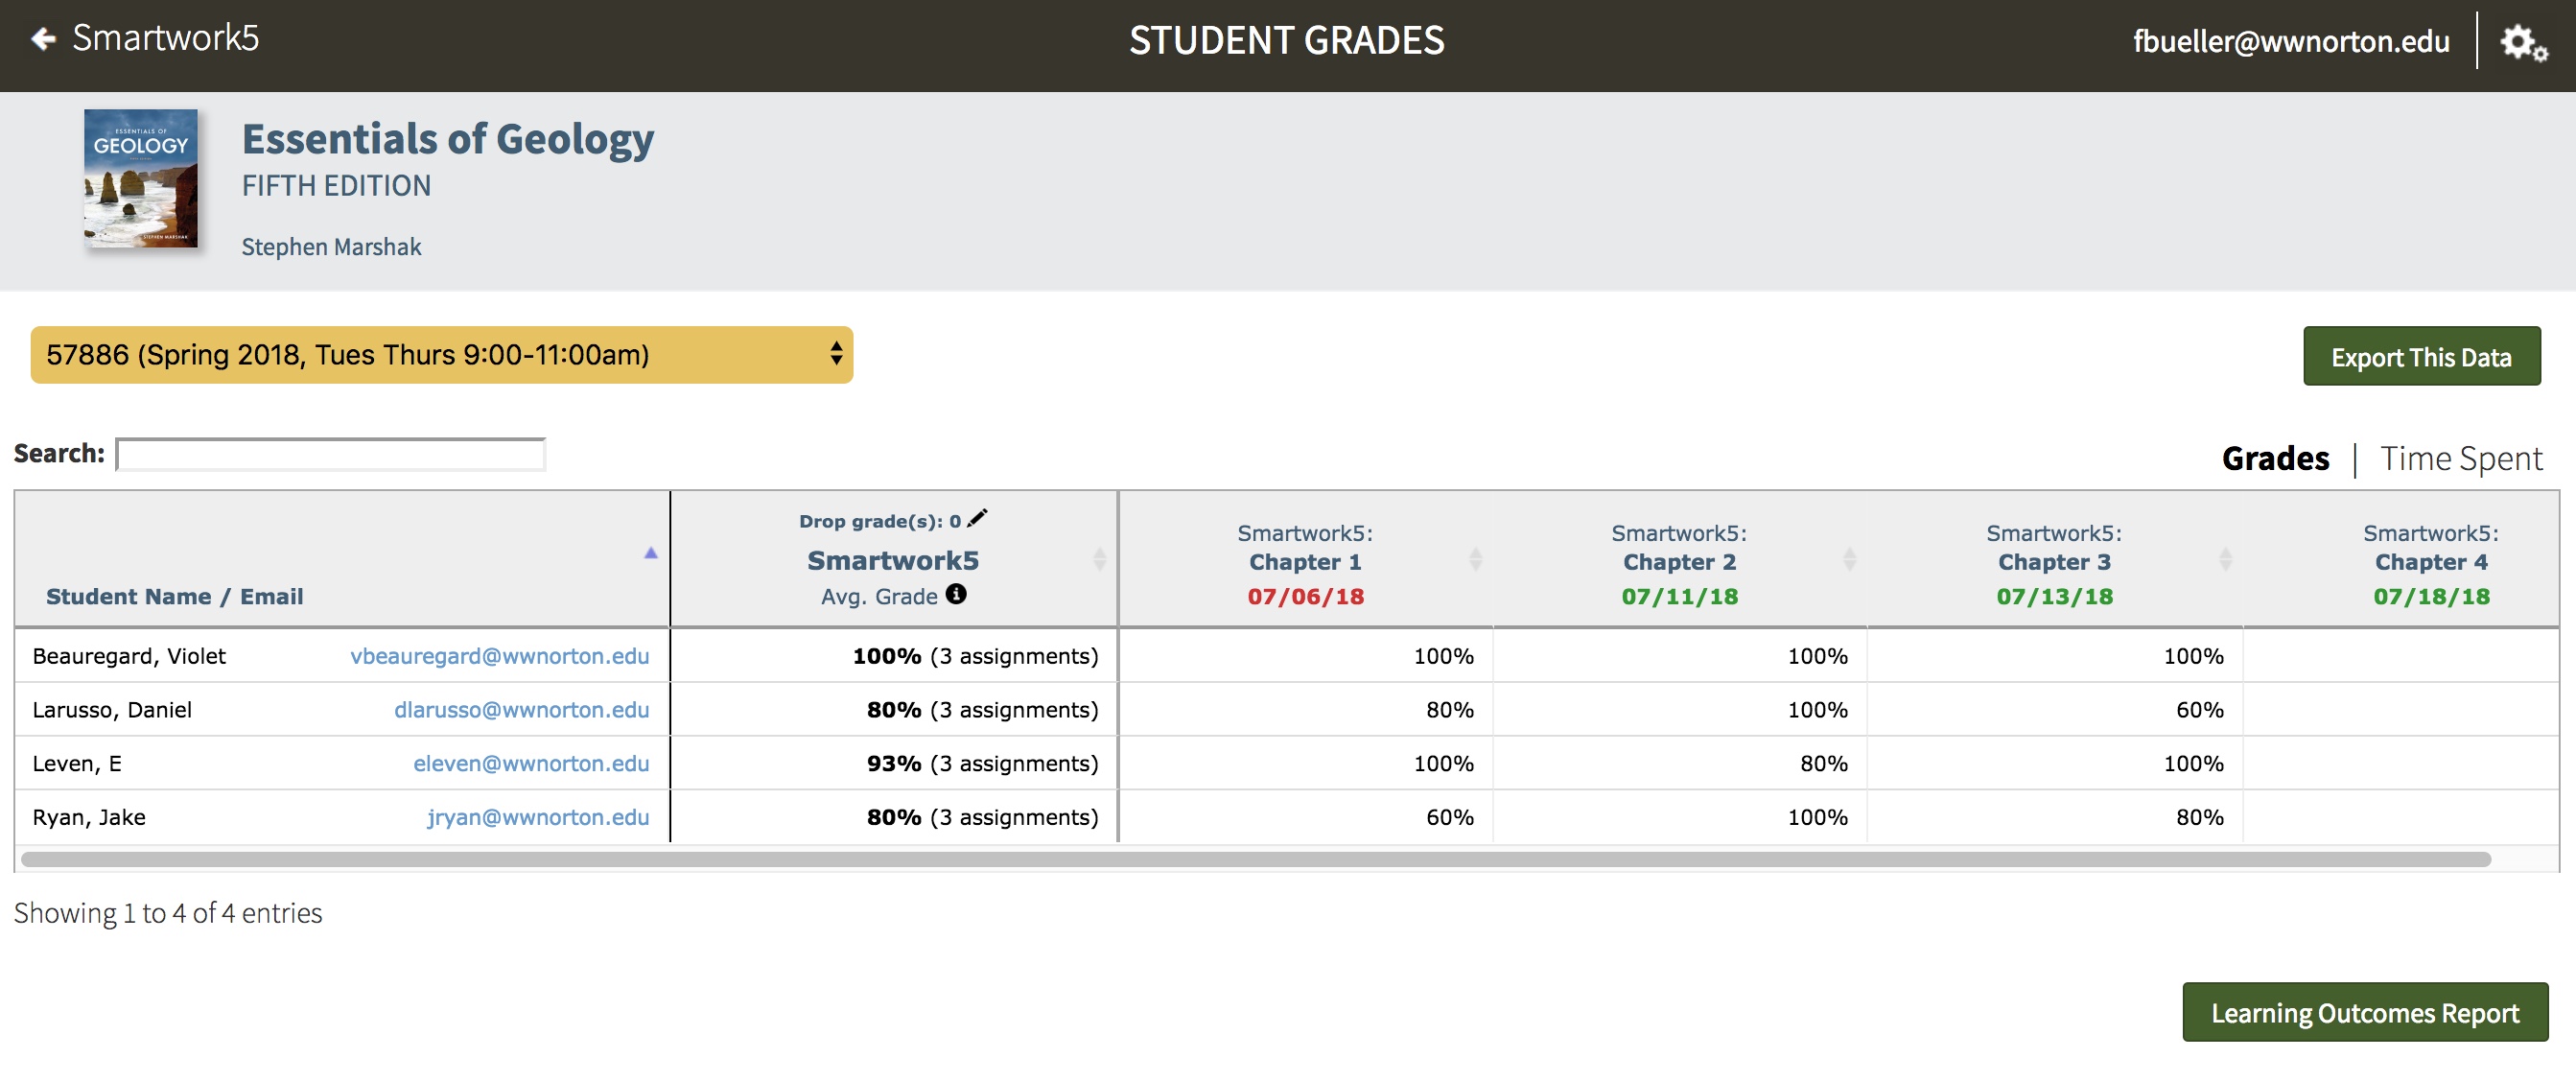
Once you click on this button, you will be taken to the Student Grades table, which displays the grades for all students for all submitted assignments within a particular Student Set.
By default, the Student Grades table will display results for the Student Set you selected on the Assignment List Page. However, you may see the results for other Student Sets on this page by selecting the Student Set you would like to see from the dropdown menu.
In the Student Grades page, you can see a breakdown of all student grades for each assignment, as well as a breakdown of how much time students spent on an assignment.
Viewing Individual Student Grades
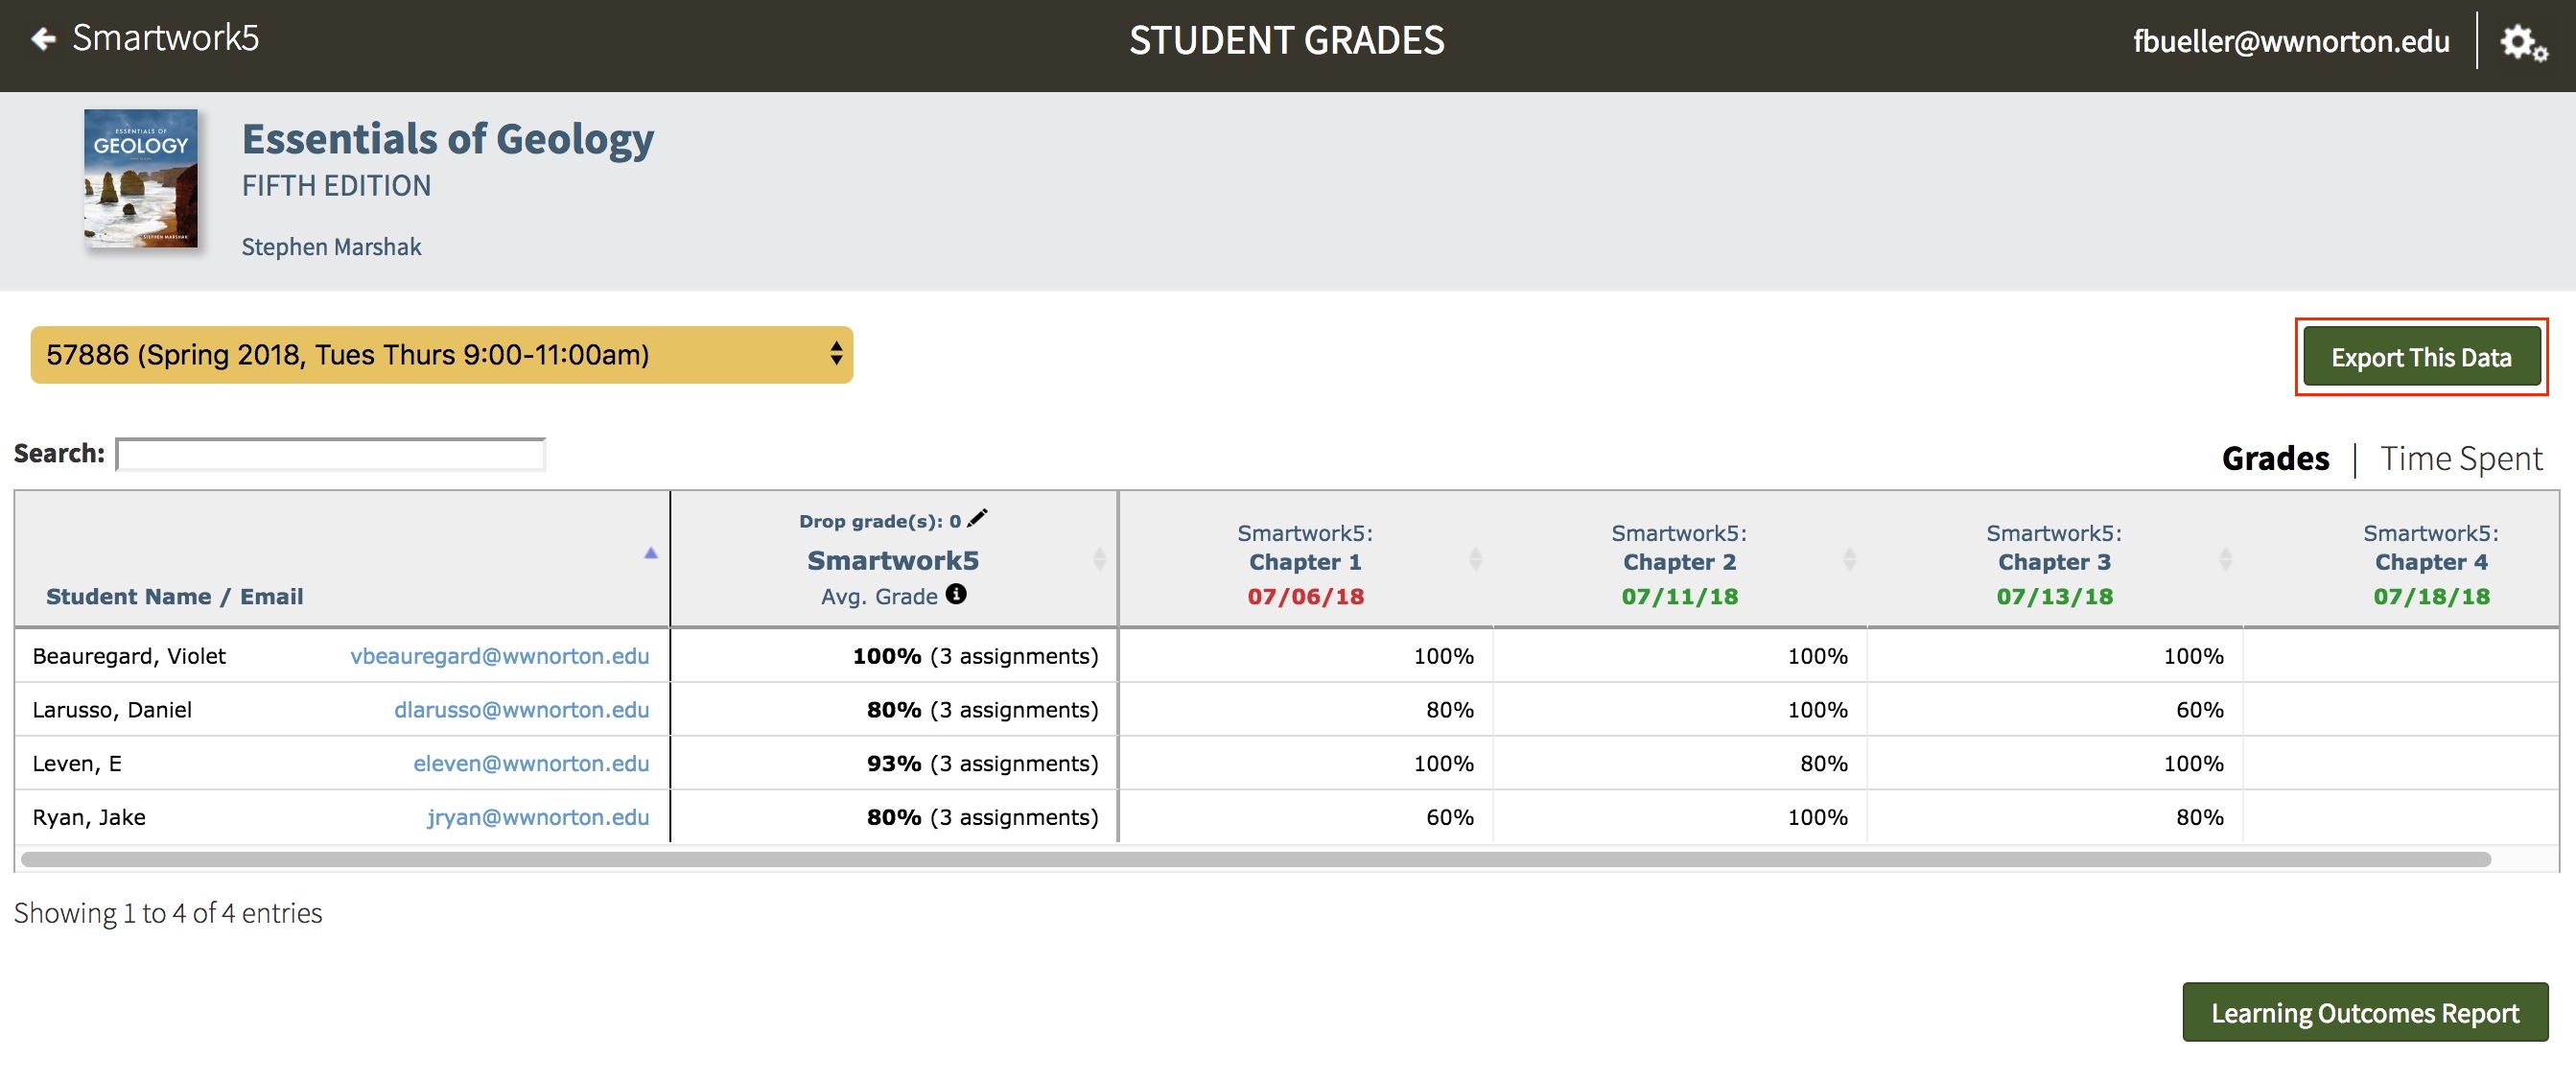
To see student Grades for each assignment, click on the word "Grades" in the upper-right corner of the Student Grades table.
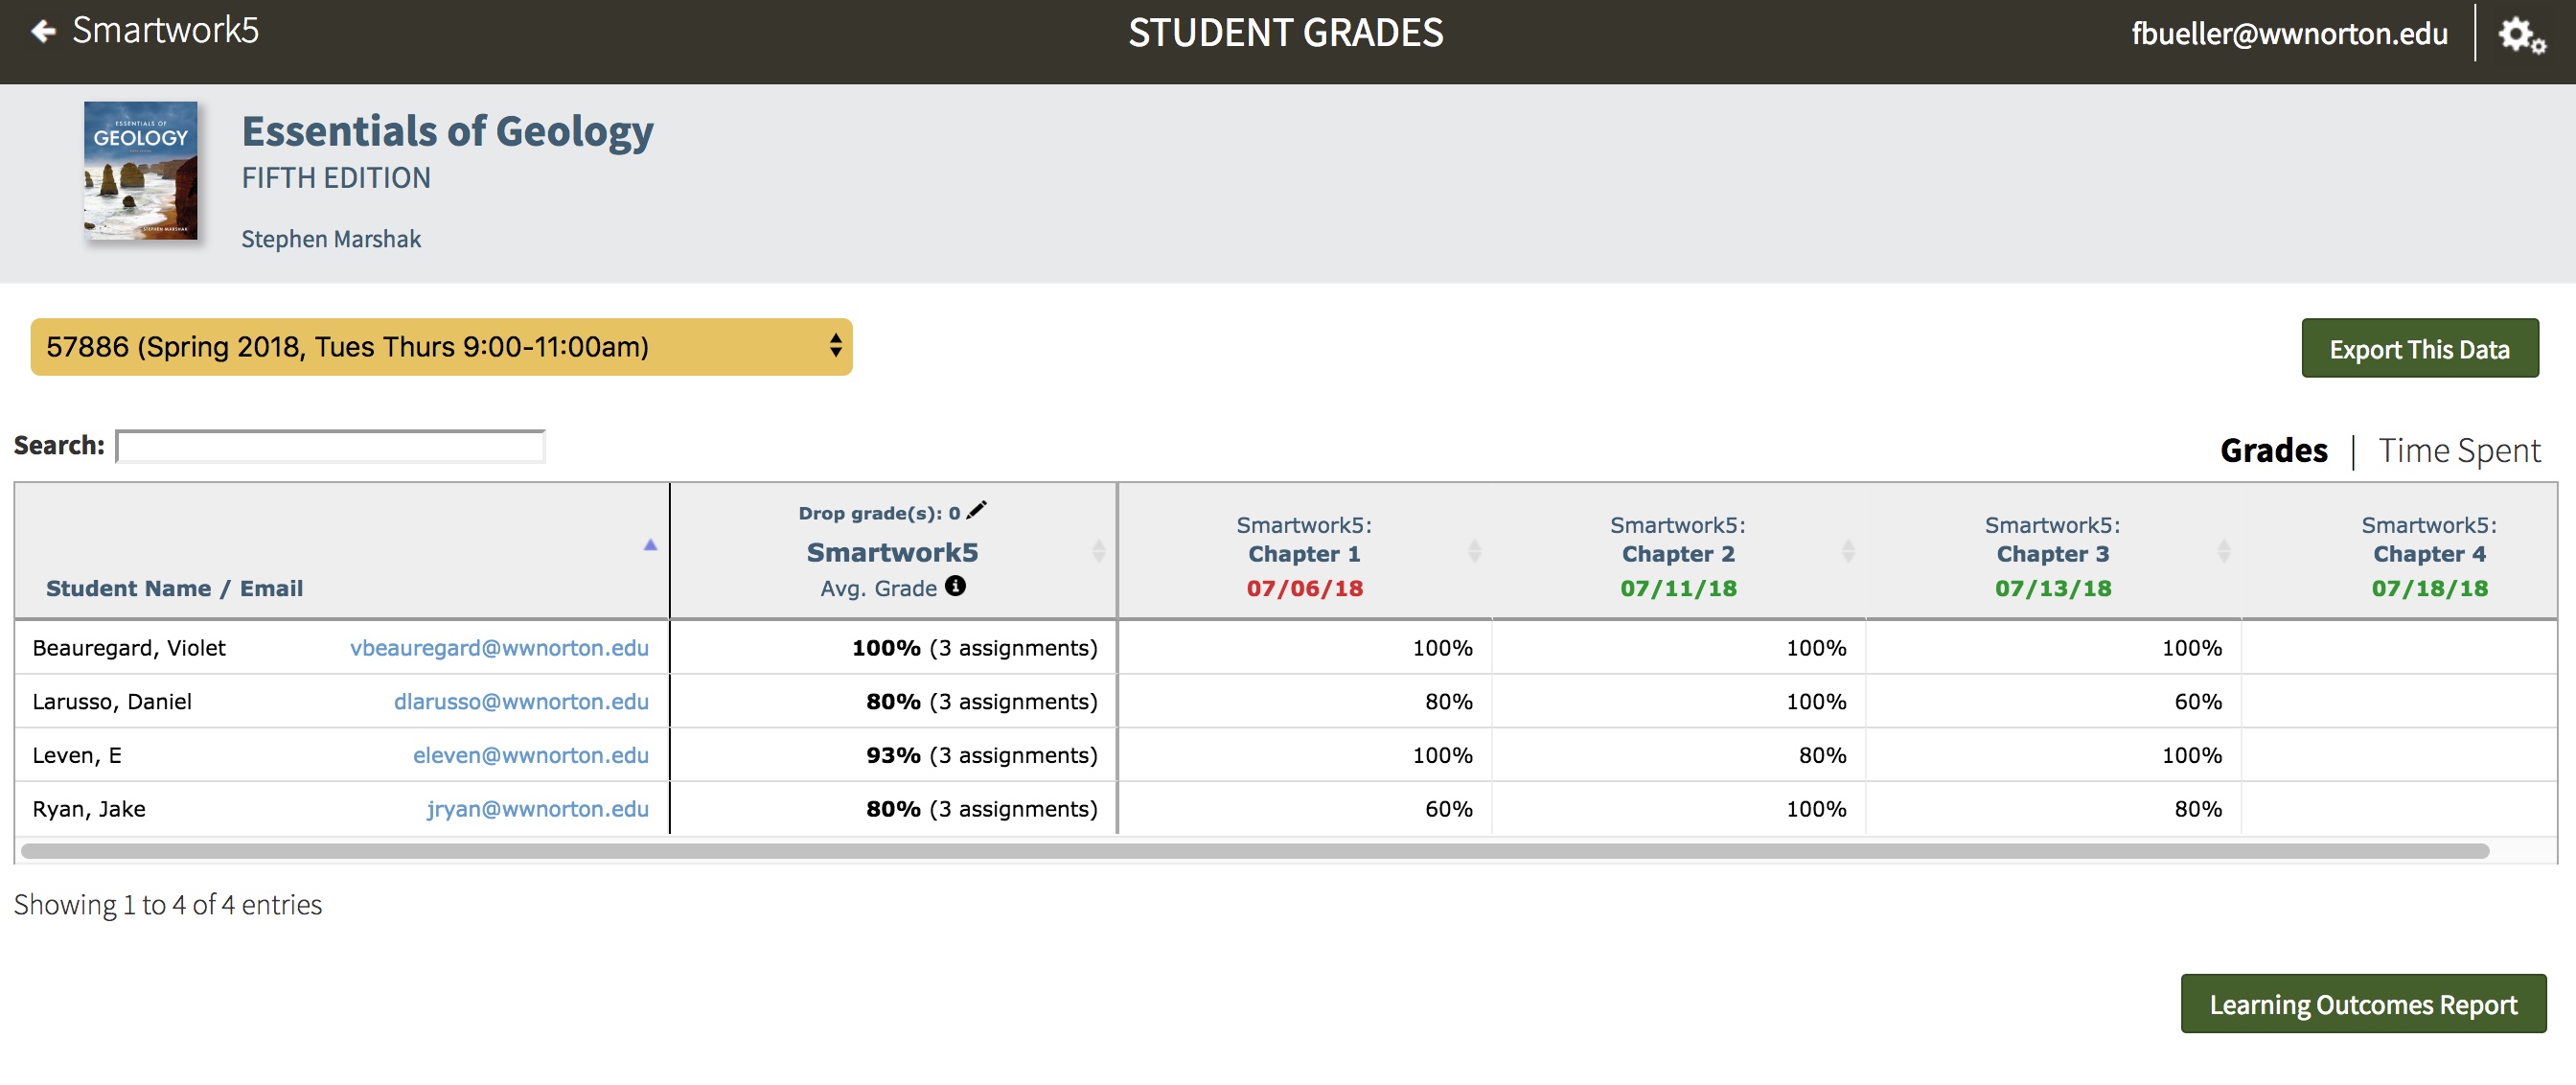
This will display a table with the students’ names and email addresses, the students’ average grades on all Smartwork assignments, and the students’ grades for each assignment. This table will display any assignment where at least one student has attempted a question.
If a student did not complete an assignment, the grade will appear as a 0.
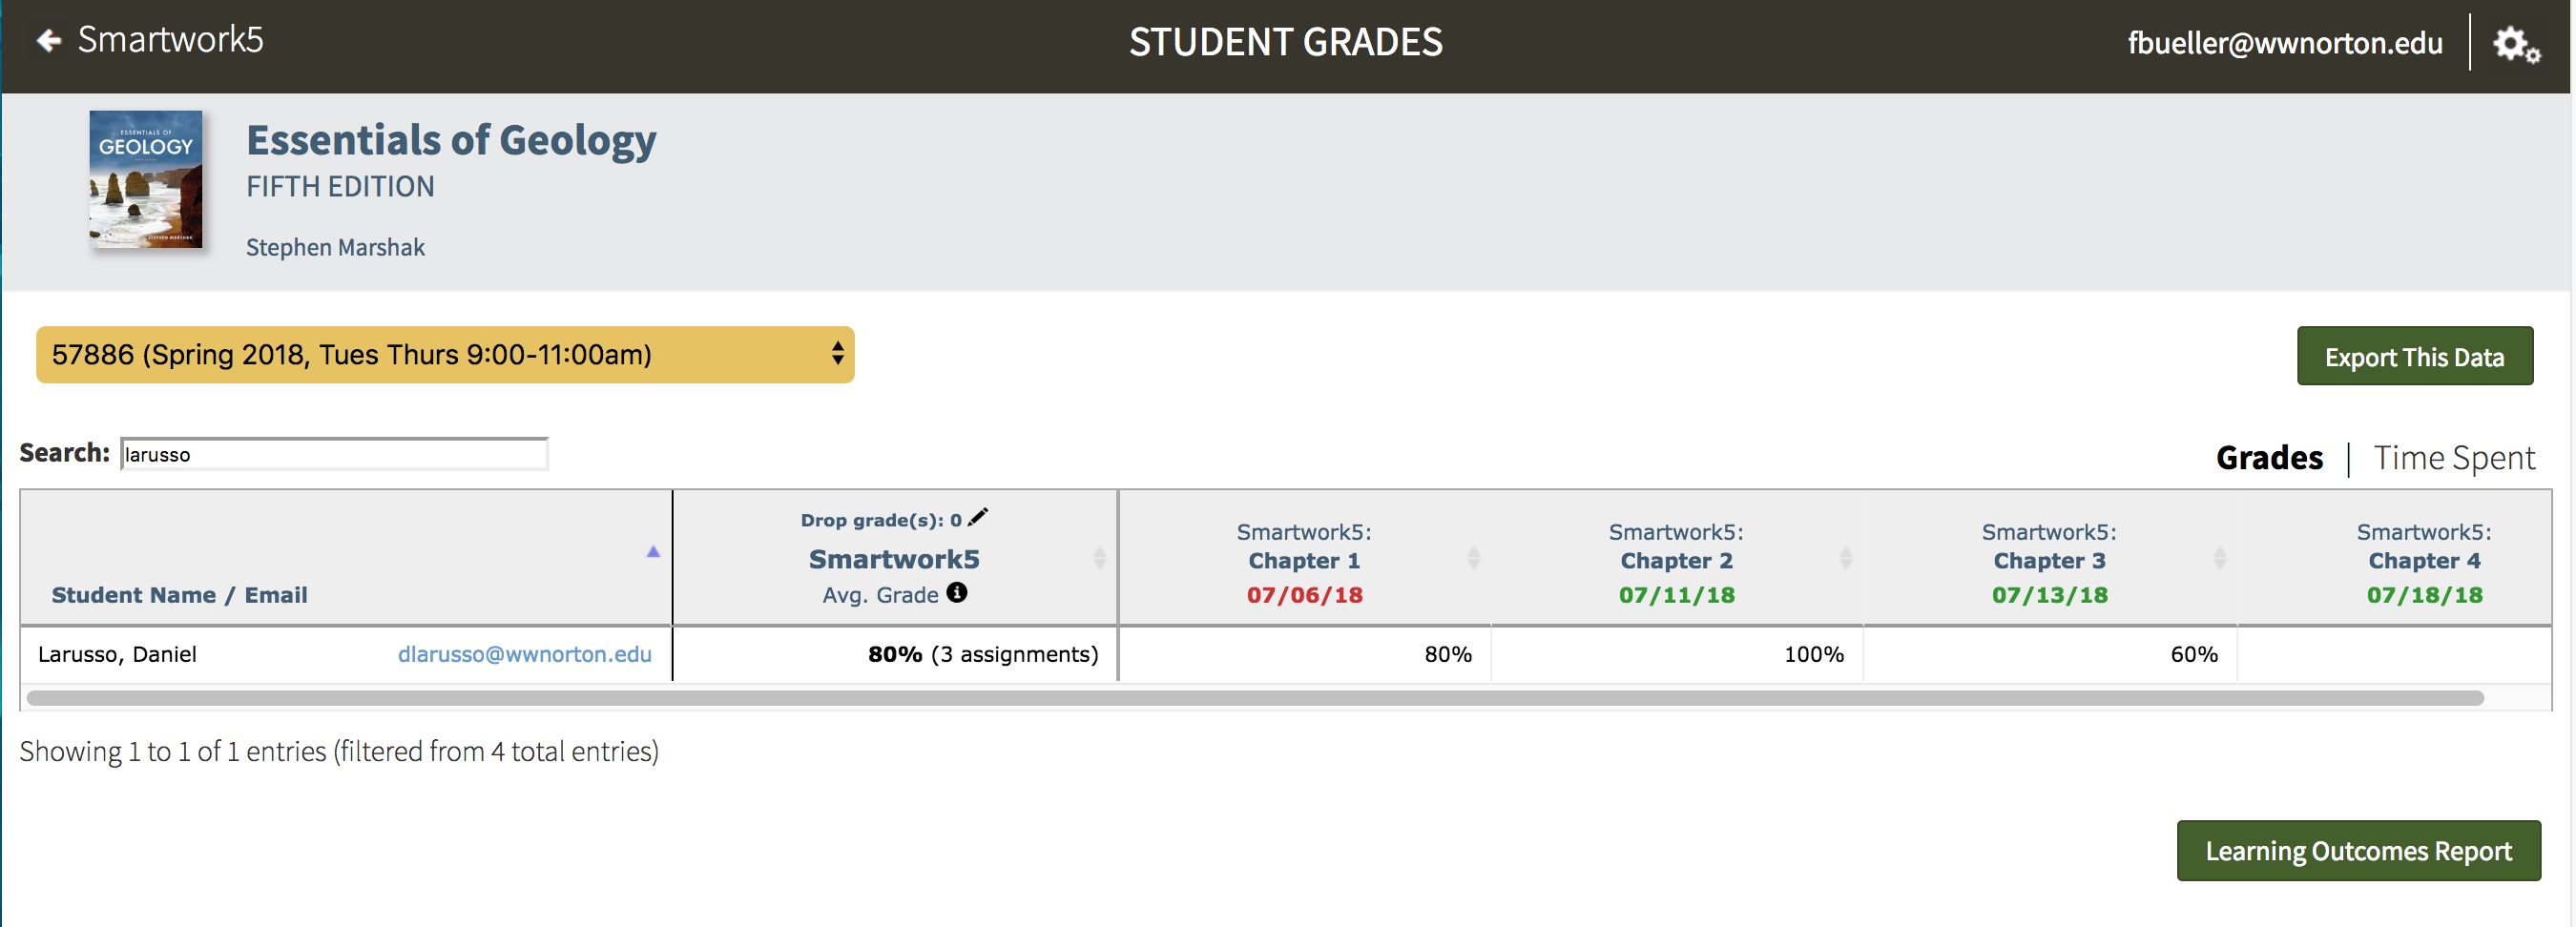
You can filter your results via the search bar. You may filter by student name or student email.
You can export the data in this table to a .csv file by clicking on the "Export This Data" button at the top-right of the Student Grades Page.
The Overall Grade In Smartwork
Smartwork calculates an overall grade for each student. This will appear in the column immediately to the right of student names.
If you are integrating Smartwork into your campus Learning Management System with individual activity links, one link per assignment, then the overall grade will not be sent over to your LMS. In this case, use your LMS gradebook to define overall grading.
Which assignments are graded?
A student’s overall Smartwork grade is calculated from assignments depending on their Grades Accepted Until (GAU) dates.
- Assignments with past GAU dates are always counted in the overall grade.
- Assignments with future GAU dates are counted only if the student has earned a score on them already.
- Assignments with no GAU date are not assigned, and are not counted in the overall grade.
How is the overall Smartwork grade calculated?
The overall grade will be calculated in one of two ways, depending on whether you’ve chosen to display assignment grades in percentages or in points.
- If your assignments display scores in percentages, then a student’s overall grade is also a percentage.
- The overall grade is an average of all of the student’s counted assignment grades.
- Percentage grading is the default assignment setting.
- In this case, all assignments are worth the same amount.
- If you have set all of your published assignments to display scores in points, then a student’s overall grade is shown as both a point value and a percentage.
- The overall grade is a total grade for all their counted assignments.
- If your published assignments have a mix of percentage and point grading, then the overall grade defaults to the percentage system.
Example: Grading in Percentages
If your Smartwork assignment scores are shown in percentages, then each student’s overall grade is their average grade on counted assignments.
For example, supposed a student has earned these grades:
- Chapter 1 Review (past due): 90%
- Chapter 2 Review (past due): 100%
- Chapter 3 Review (not yet due): 80%
- Chapter 4 Review (not yet due): — (the student hasn’t started yet)
- Math Review (no due date): 80%
This student’s overall score counts Chapter Reviews 1 and 2 because they’re past due, and Chapter 3 Review because the student has earned a score.
Chapter 4 Review isn't counted because the student hasn’t done any work yet, and the Math Review isn’t counted because it doesn’t have a due date (that is, it’s unassigned).
So the student’s overall score is the average of Chapter Reviews 1–3: (90 + 100 + 80) ÷ 3 = 90%
If you have integrated Smartwork with your campus Learning Management System with a single homepage link, this should be the grade you see for that student in your LMS gradebook.
Example: Grading in Points
If your Smartwork assignment scores are shown in points as well as percentages, then each student’s overall grade is the combined grade of all their counted assignments.
For example, suppose a student has earned these grades:
- Chapter 1 Review (past due): 9/10 (90%)
- Chapter 2 Review (past due): 10/10 (100%)
- Chapter 3 Review (not yet due): 12/15 (80%)
- Chapter 4 Review (not yet due): — (the student hasn’t started yet)
- Math Review (no due date): 16/20 (80%)
This student’s overall score counts Chapter Reviews 1 and 2 because they’re past due, and Chapter 3 Review because the student has earned a score.
Chapter 4 Review isn't counted because the student hasn’t done any work yet, and the Math Review isn’t counted because it doesn’t have a due date (that is, it’s unassigned).
So the student’s overall score is the total from Chapter Reviews 1–3: (9 + 10 + 12) / (10 + 10 + 15) = 31/35 (89%)
If you have integrated Smartwork with your campus Learning Management System with a single homepage link, the percentage grade should be the grade you see for that student in your LMS gradebook.
Viewing Time Spent in an Assignment
To see the amount of time a student spent in each activity, click on "Time Spent" in the upper-right corner of the Student Grades page.
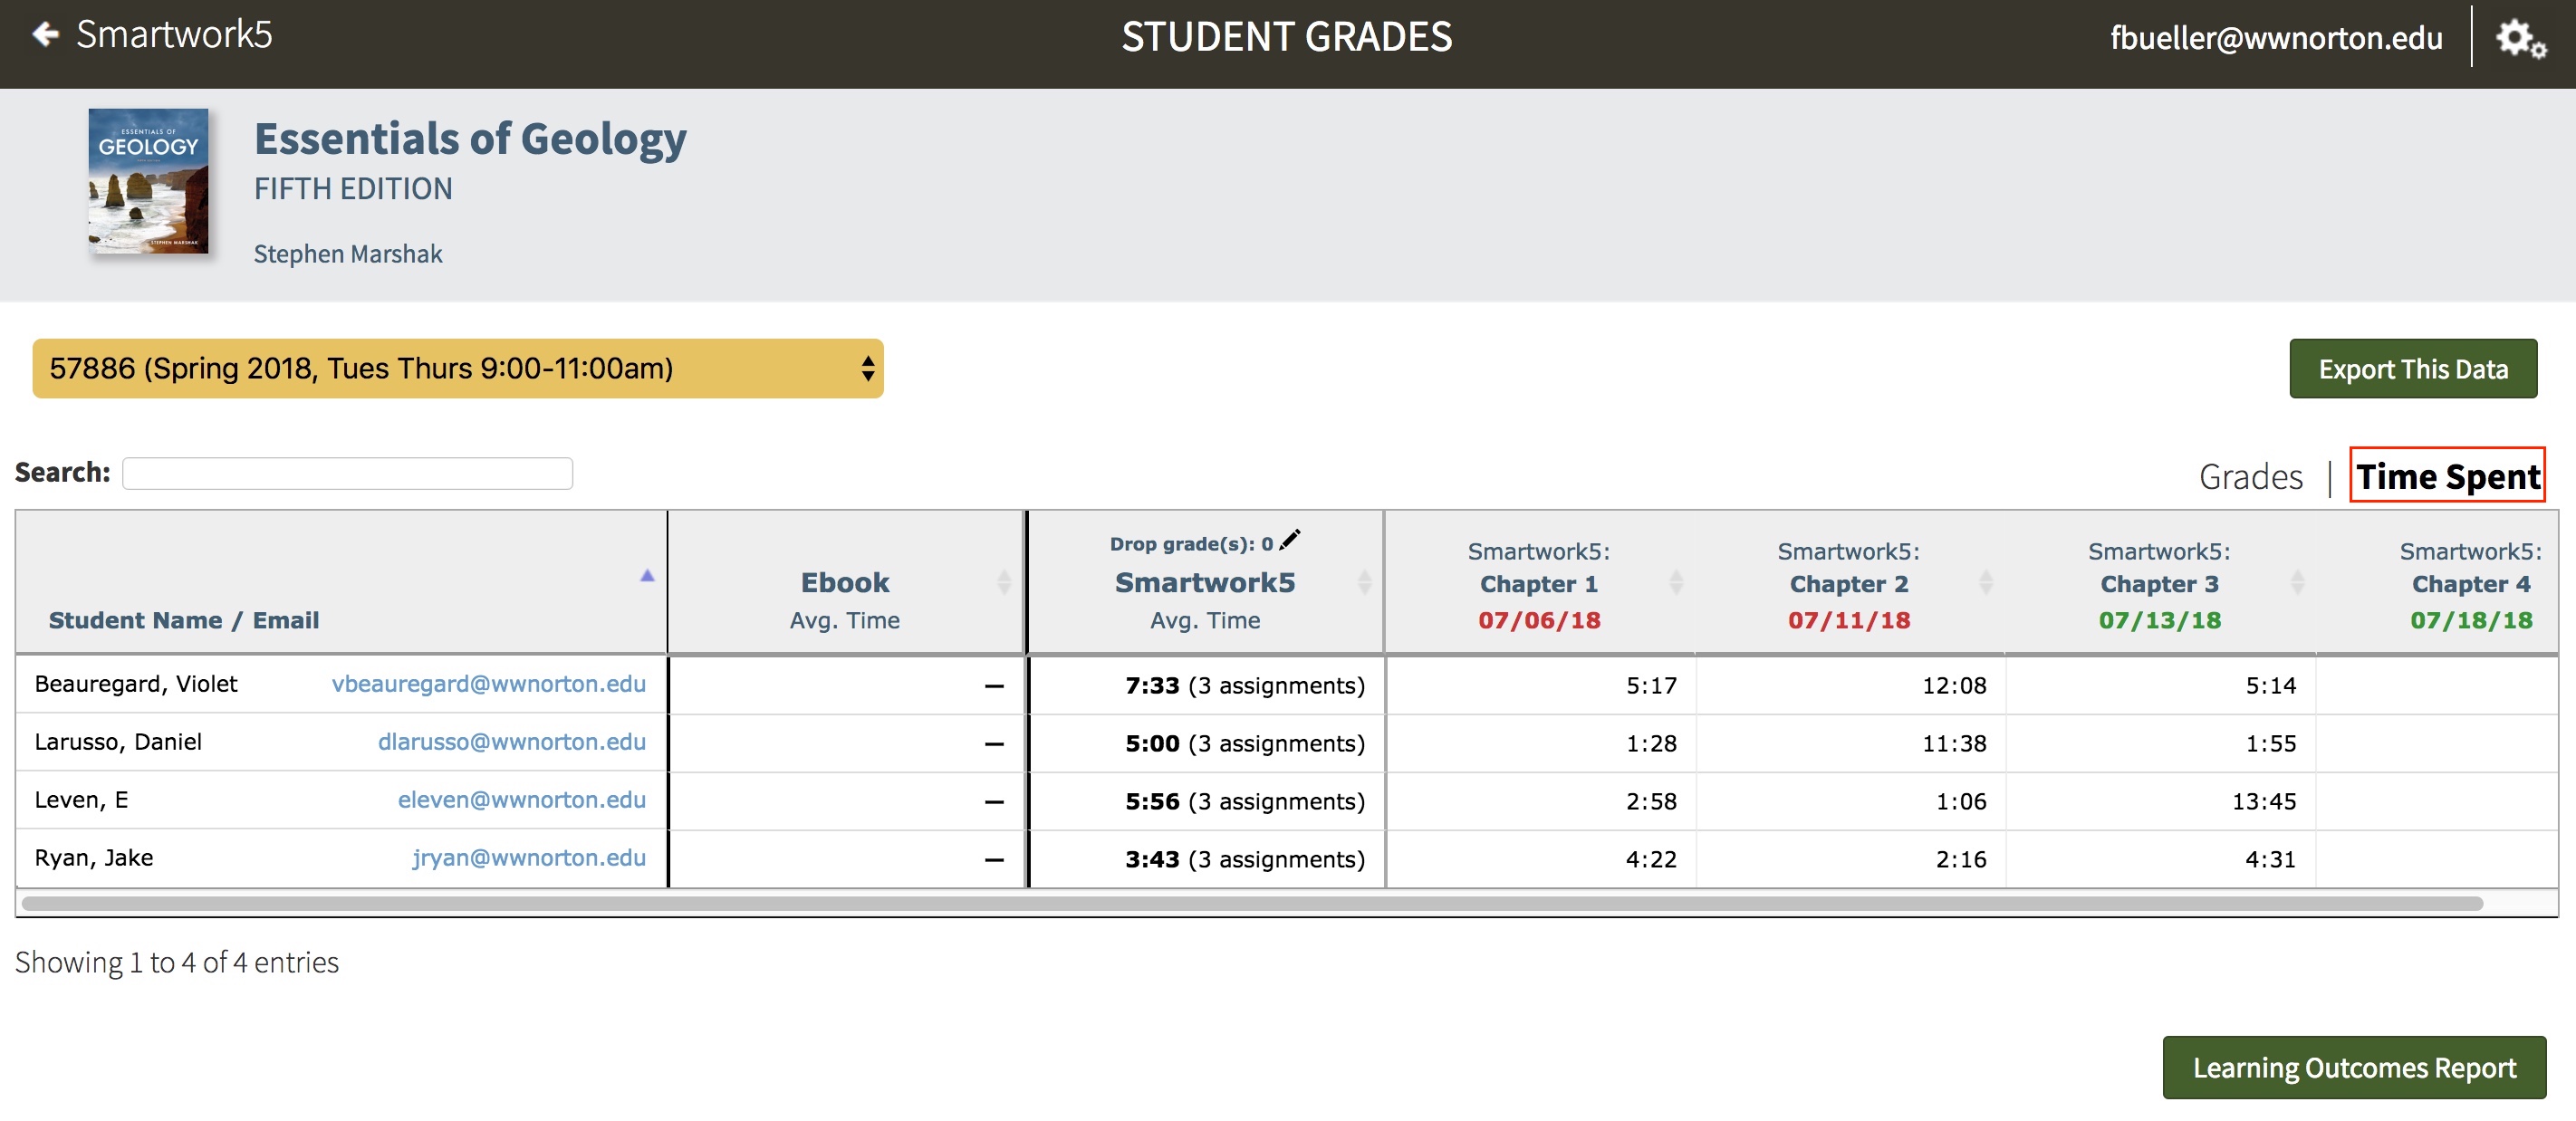
You can filter your results by entering a student’s name or email address into the search bar.
Assignment List Page
The course Assignment List Page shows an average of all student grades by assignment. To see this data, first select the desired Student Set in the dropdown menu, as seen below.
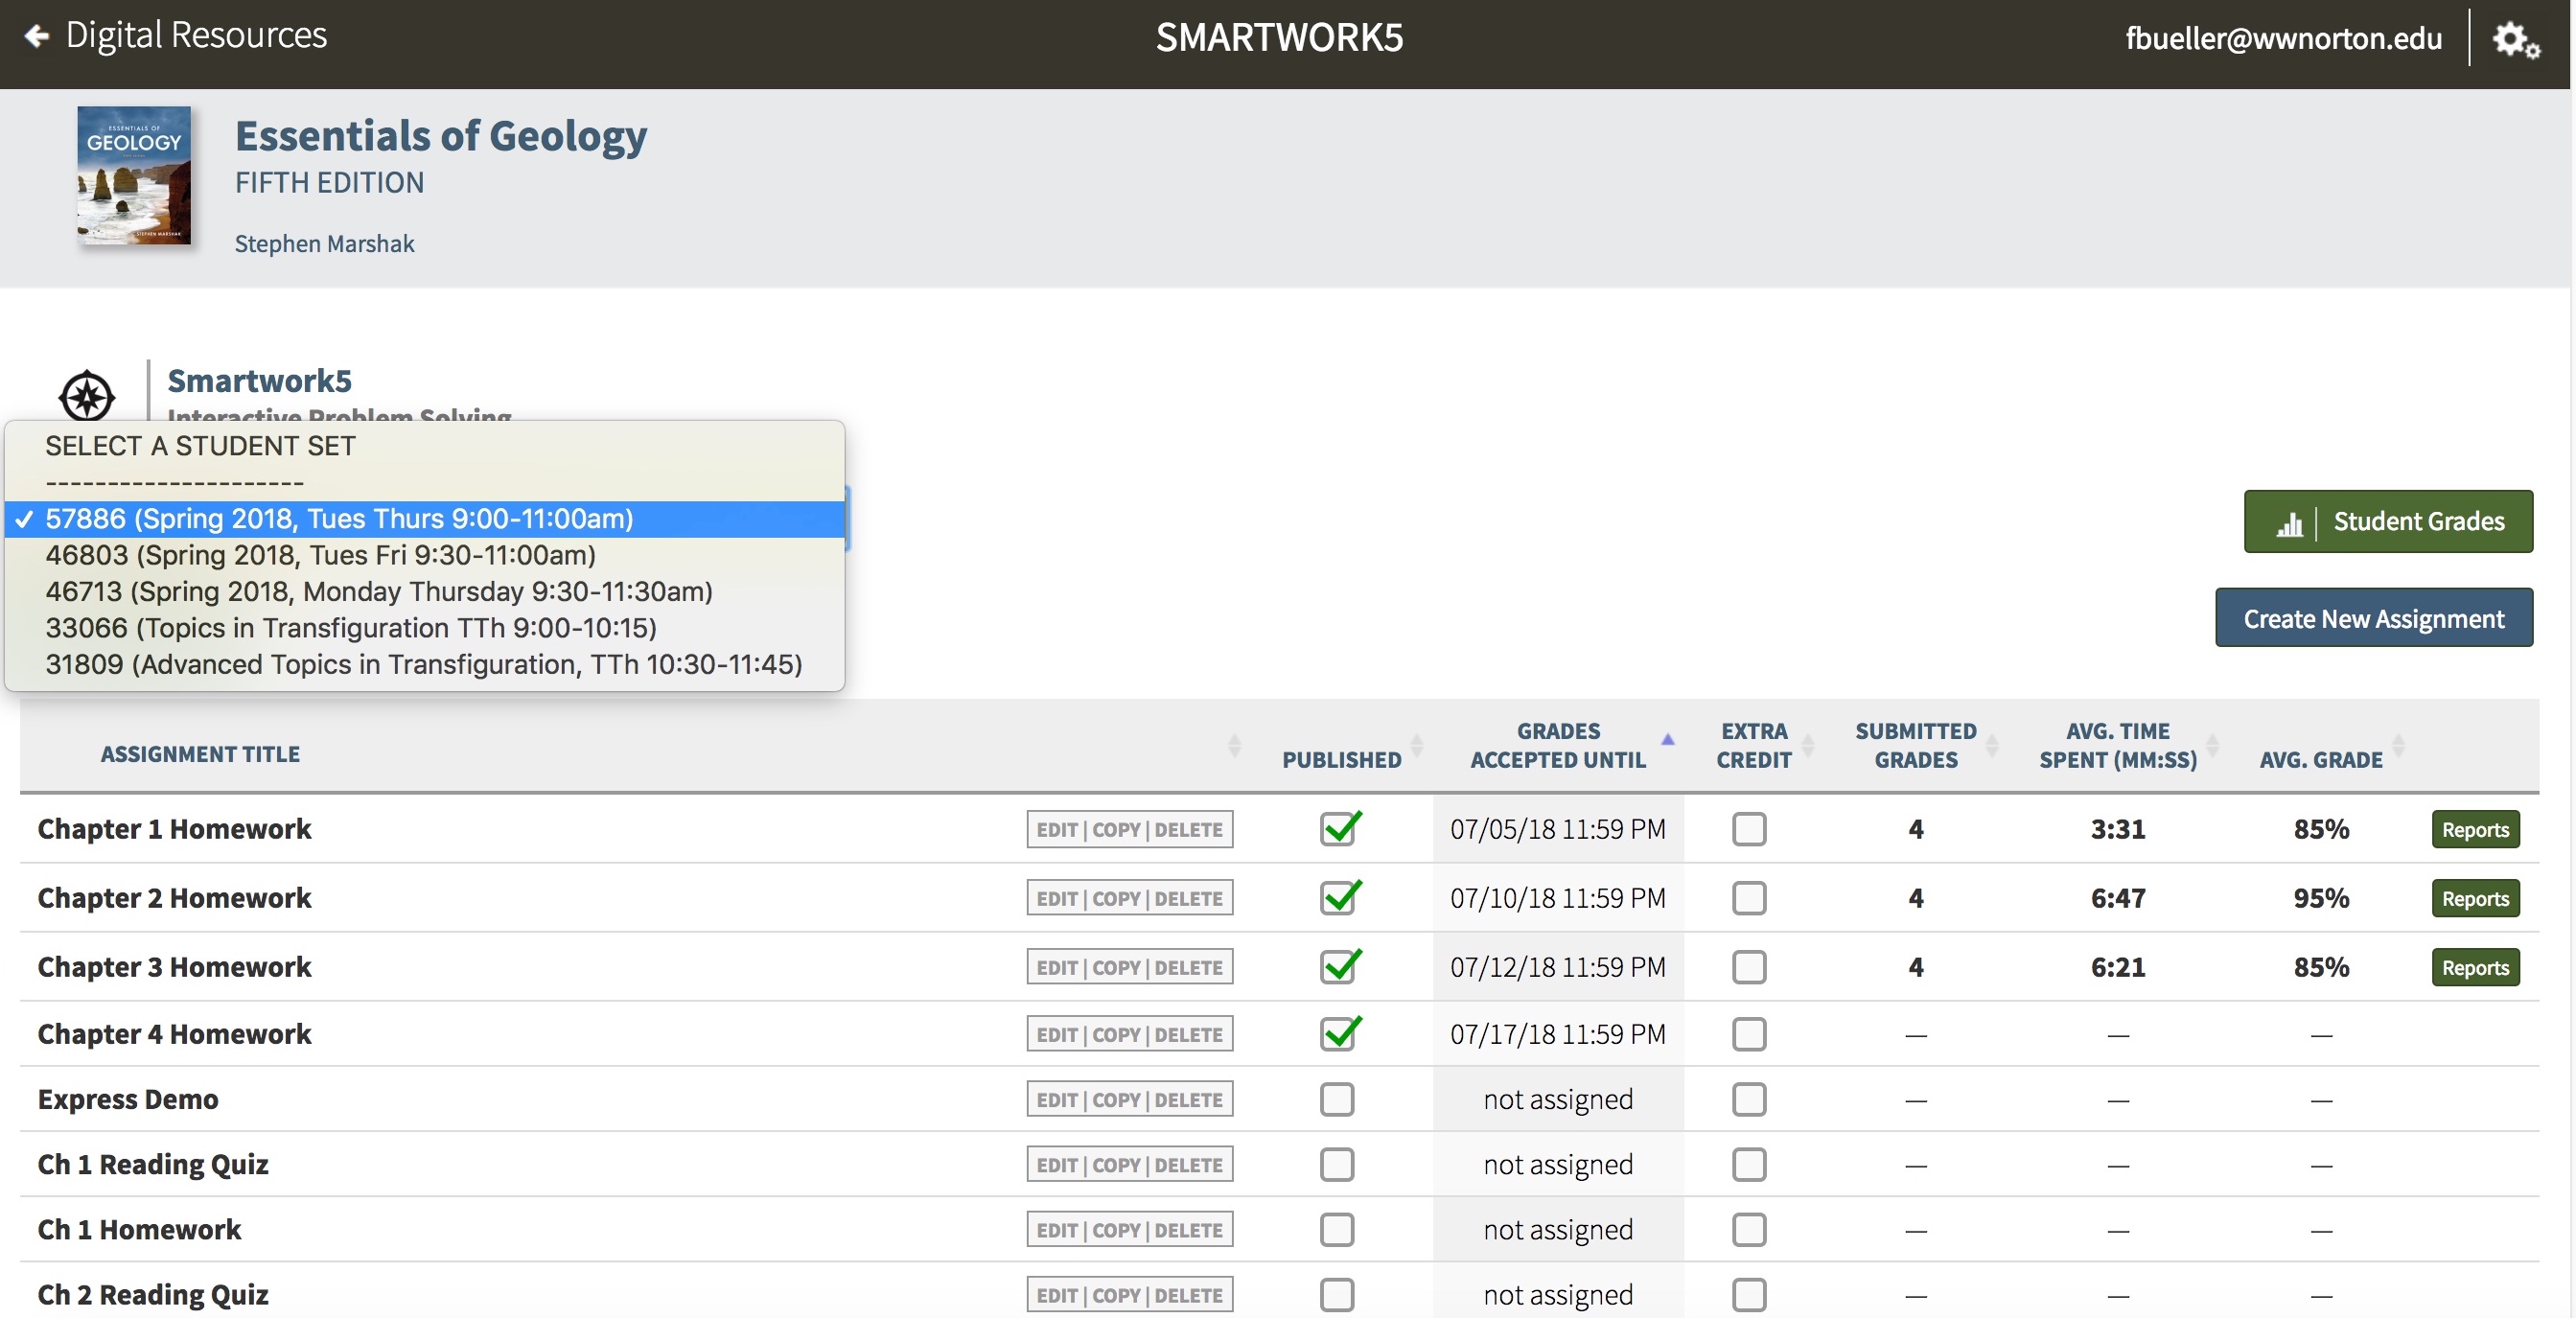
Once you select the Student Set, you will see that the assignments with assigned Grades Accepted Until dates will automatically filter to the top of the Assignment List Page.
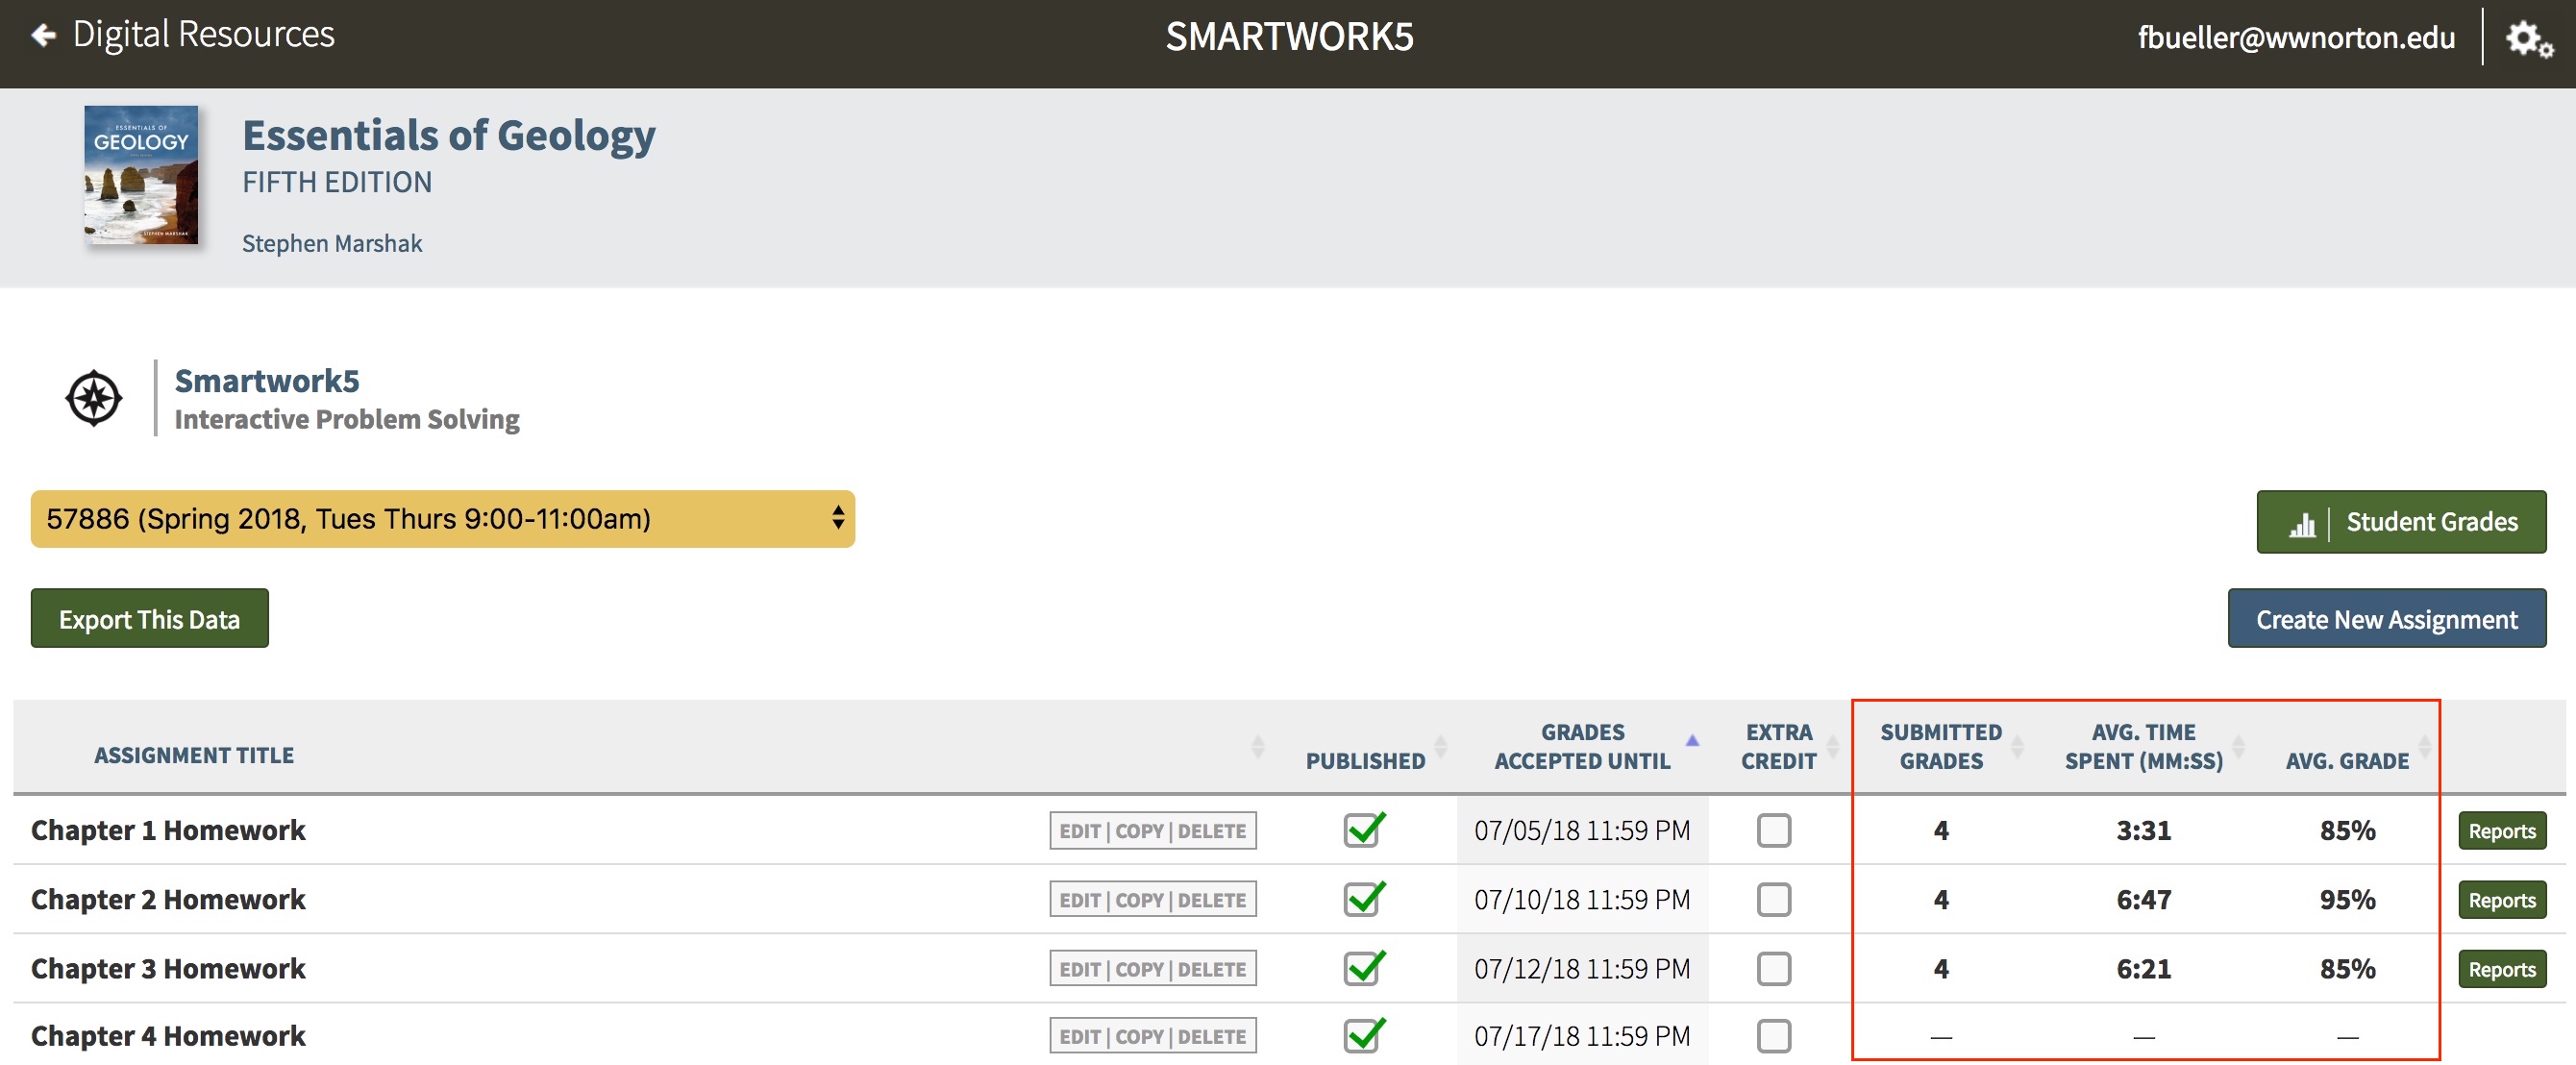
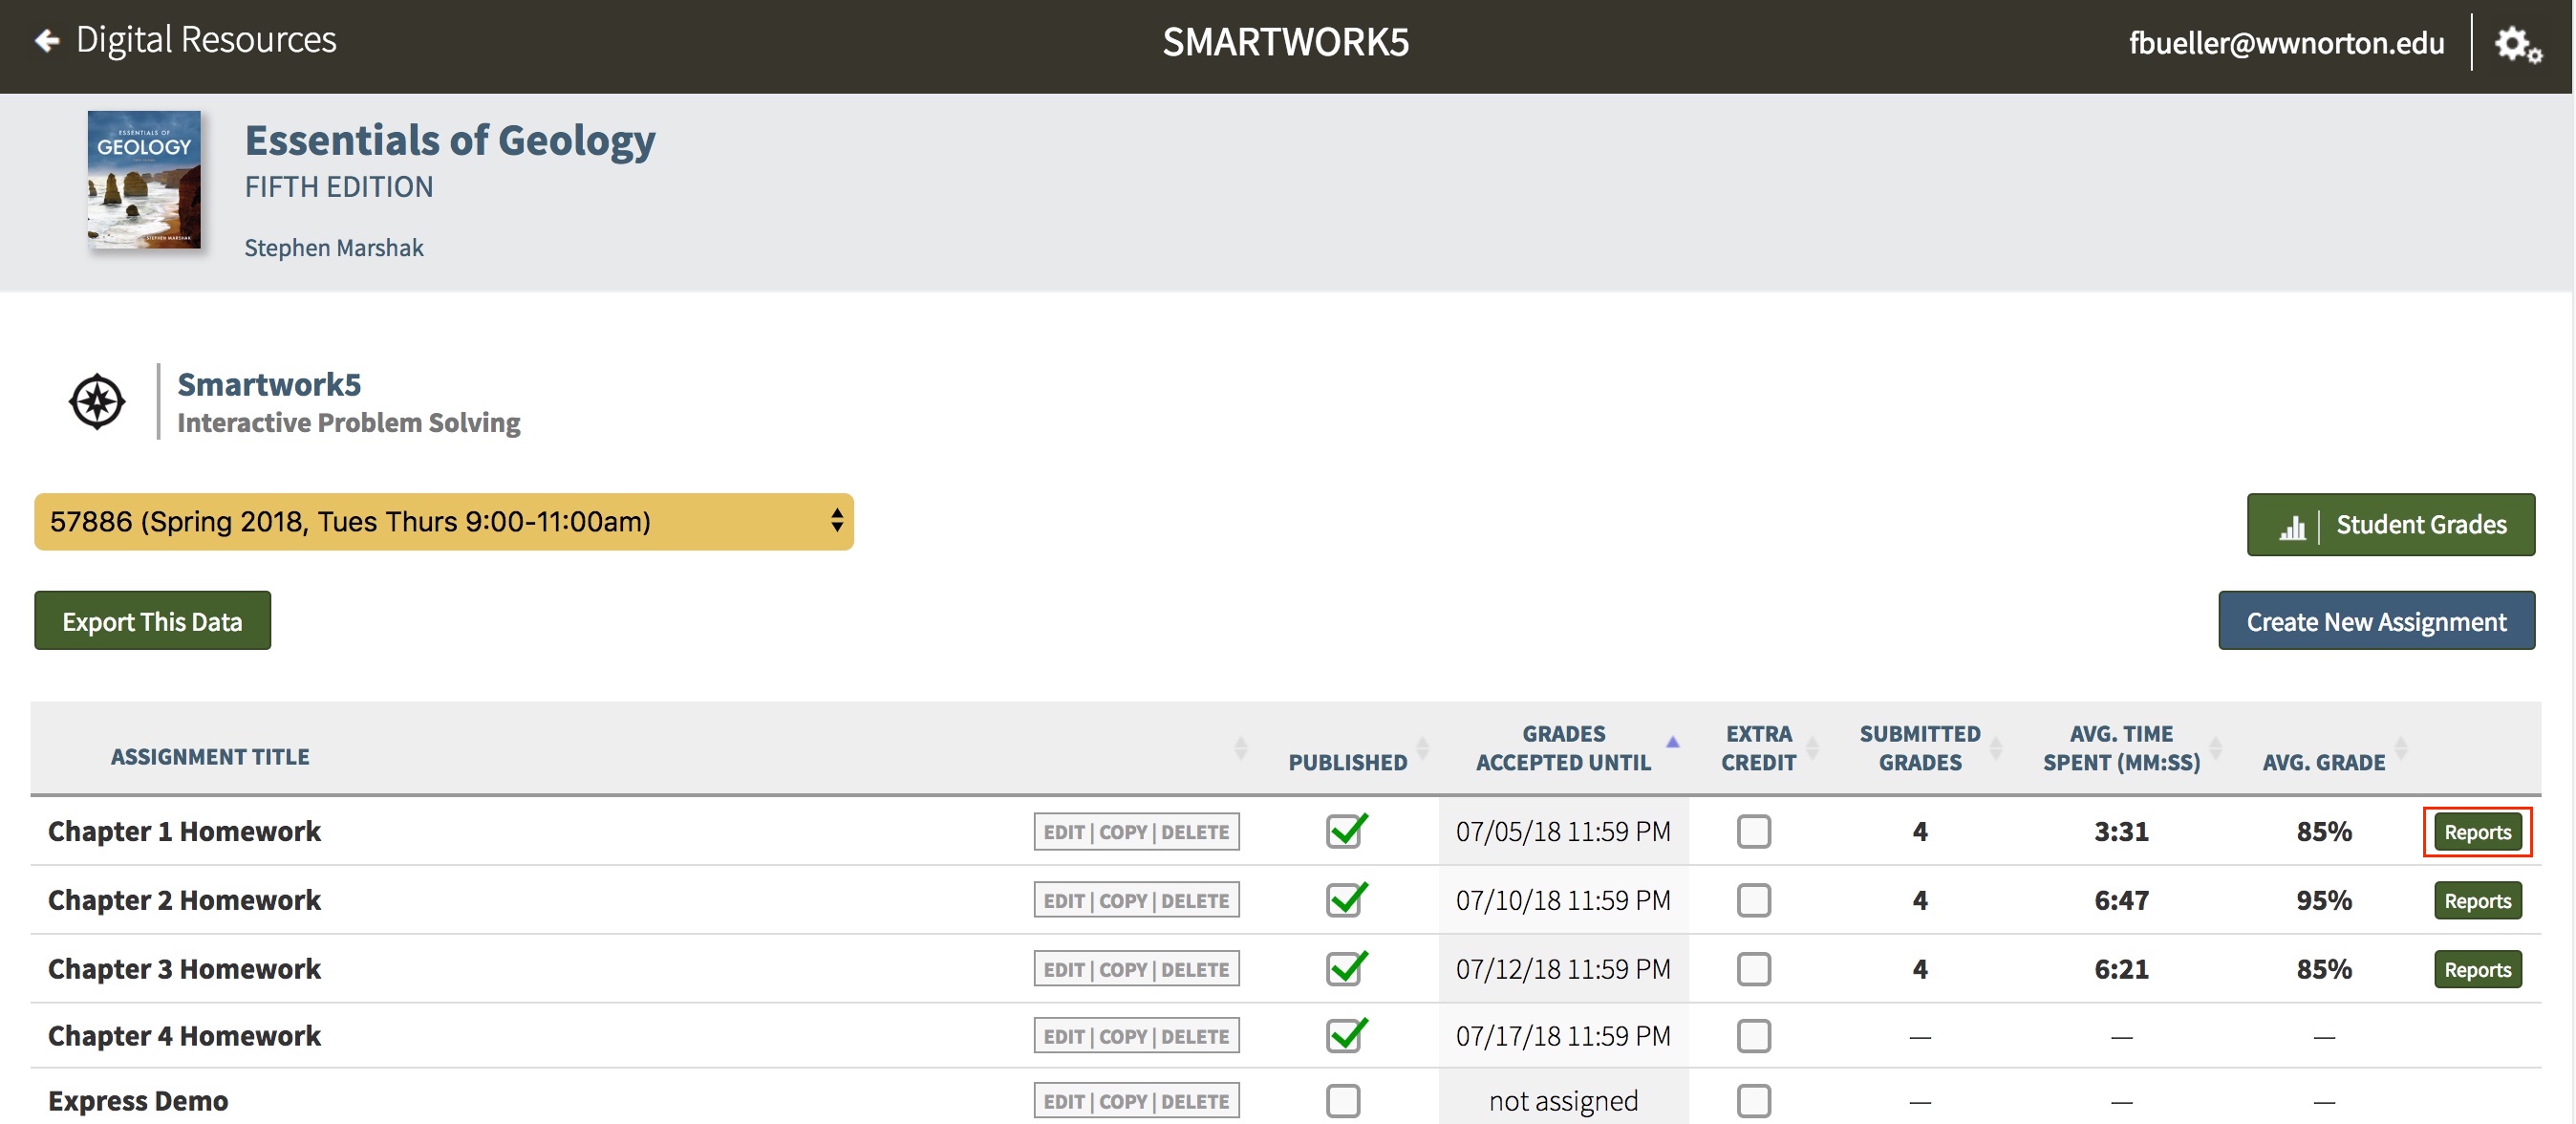
The Activity List displays an aggregate of student results in the following categories:
- Submitted grades – this is a count of the number of students who successfully recorded their grades for the assignment. This count does not include students who started the activity and did not record their grades.
- Average Time Spent – this is an average of the amount of time students spent in the assignment.
- Average Grade – this is the average of the grades students earned on the assignment.
For each assignment with recorded grades, you can access in-depth performance reports for that activity by clicking on the "Reports" button. We will discuss this further in the next section.
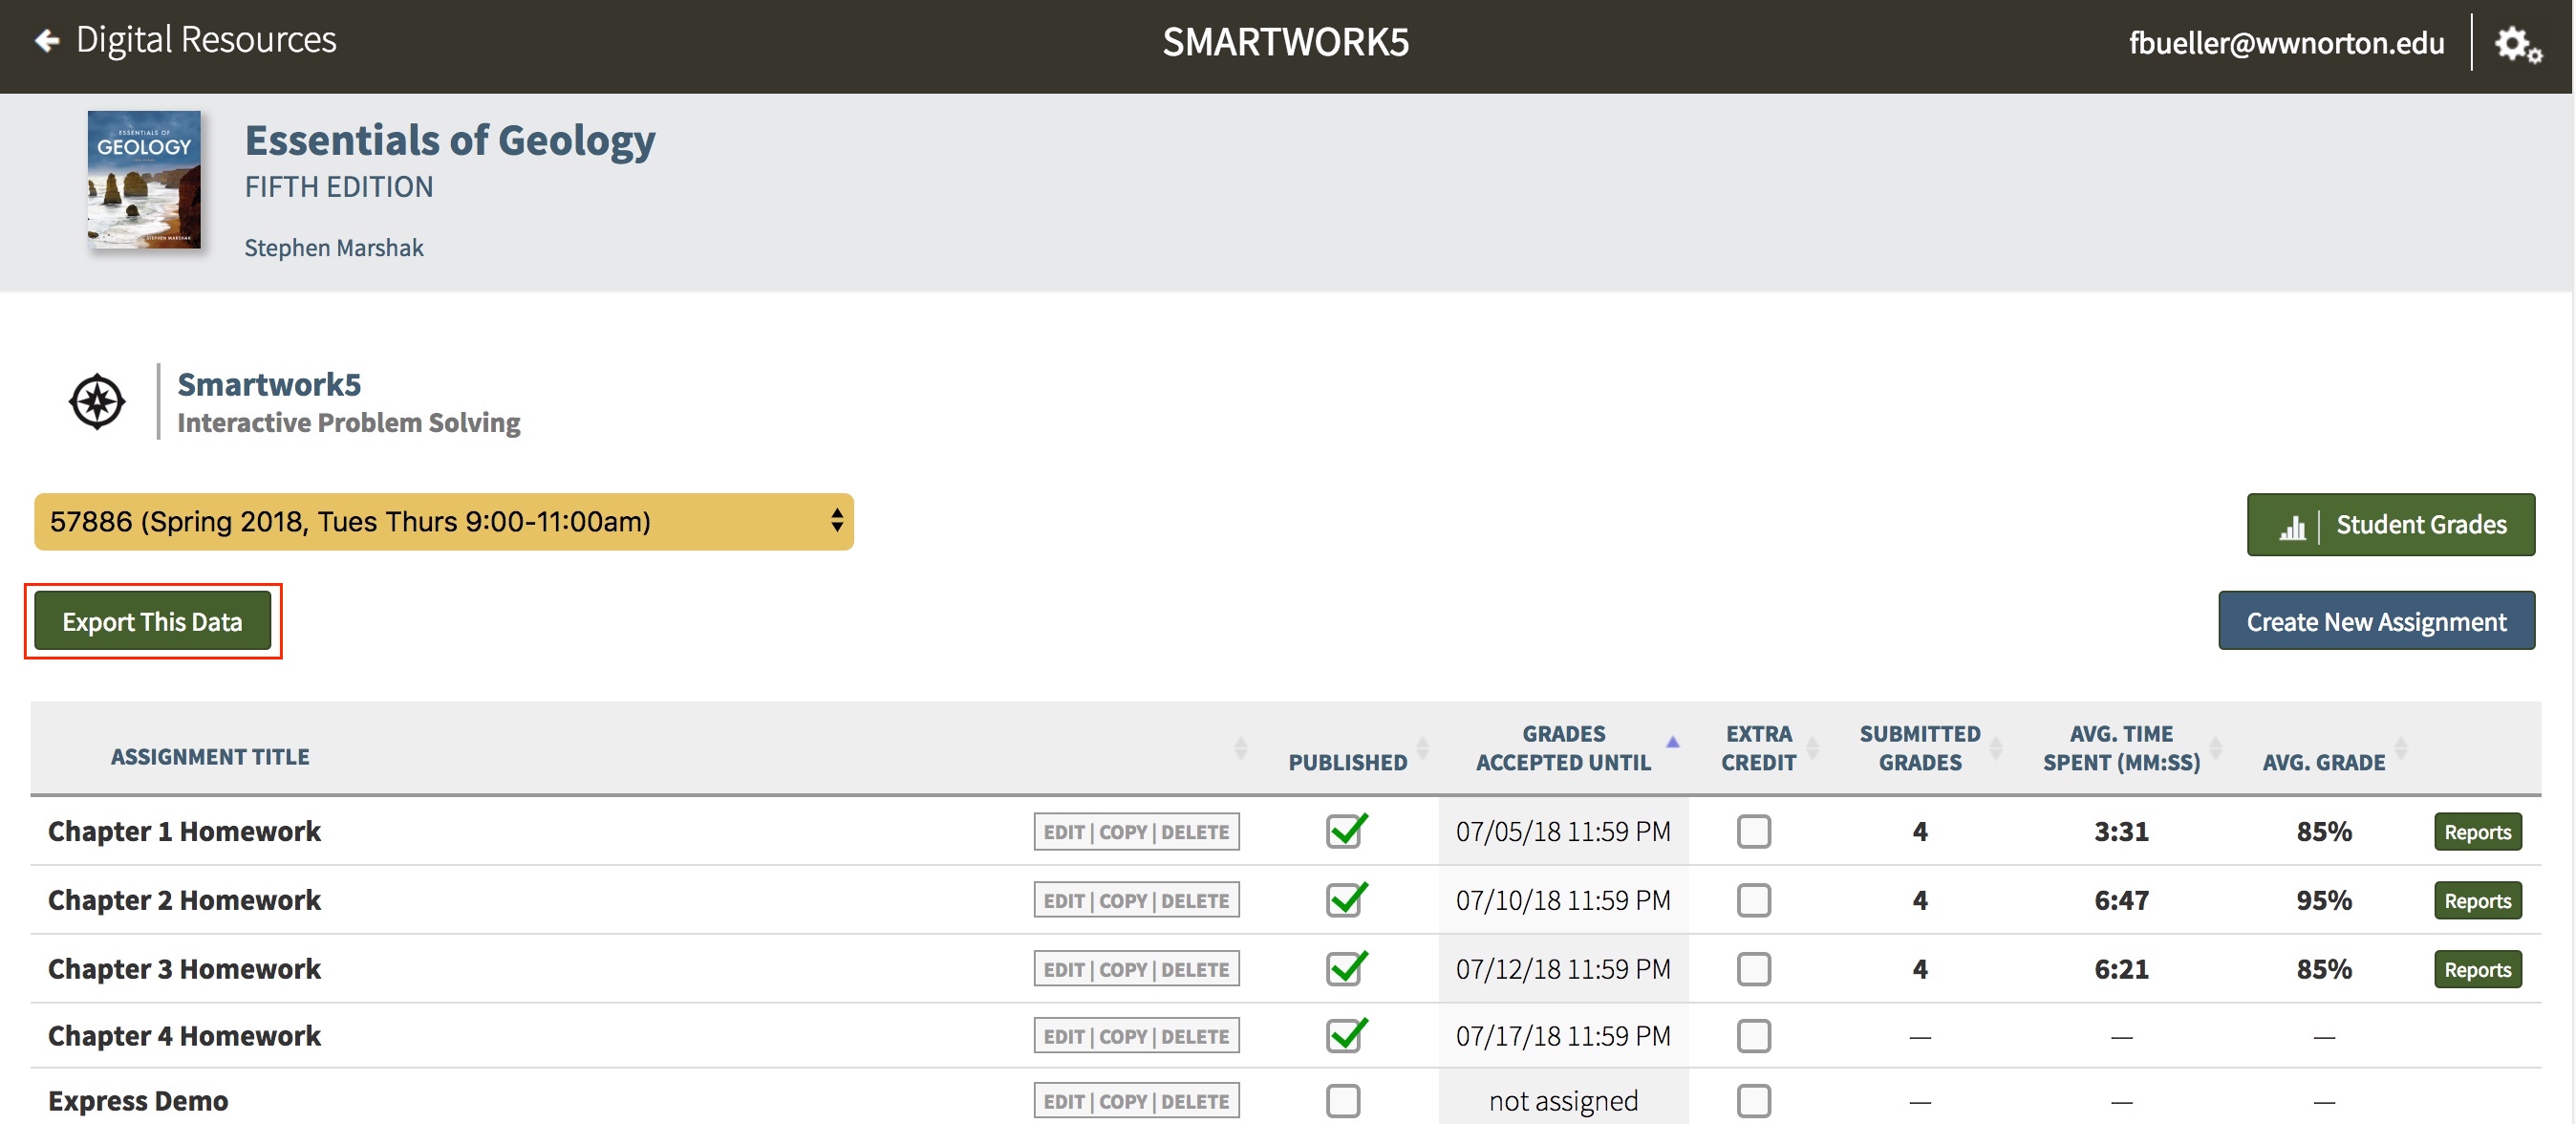
Exporting Data in the Activity List
To export the Assignment List data to a .csv file, click on the "Export This Data" button below the Student Set dropdown list.
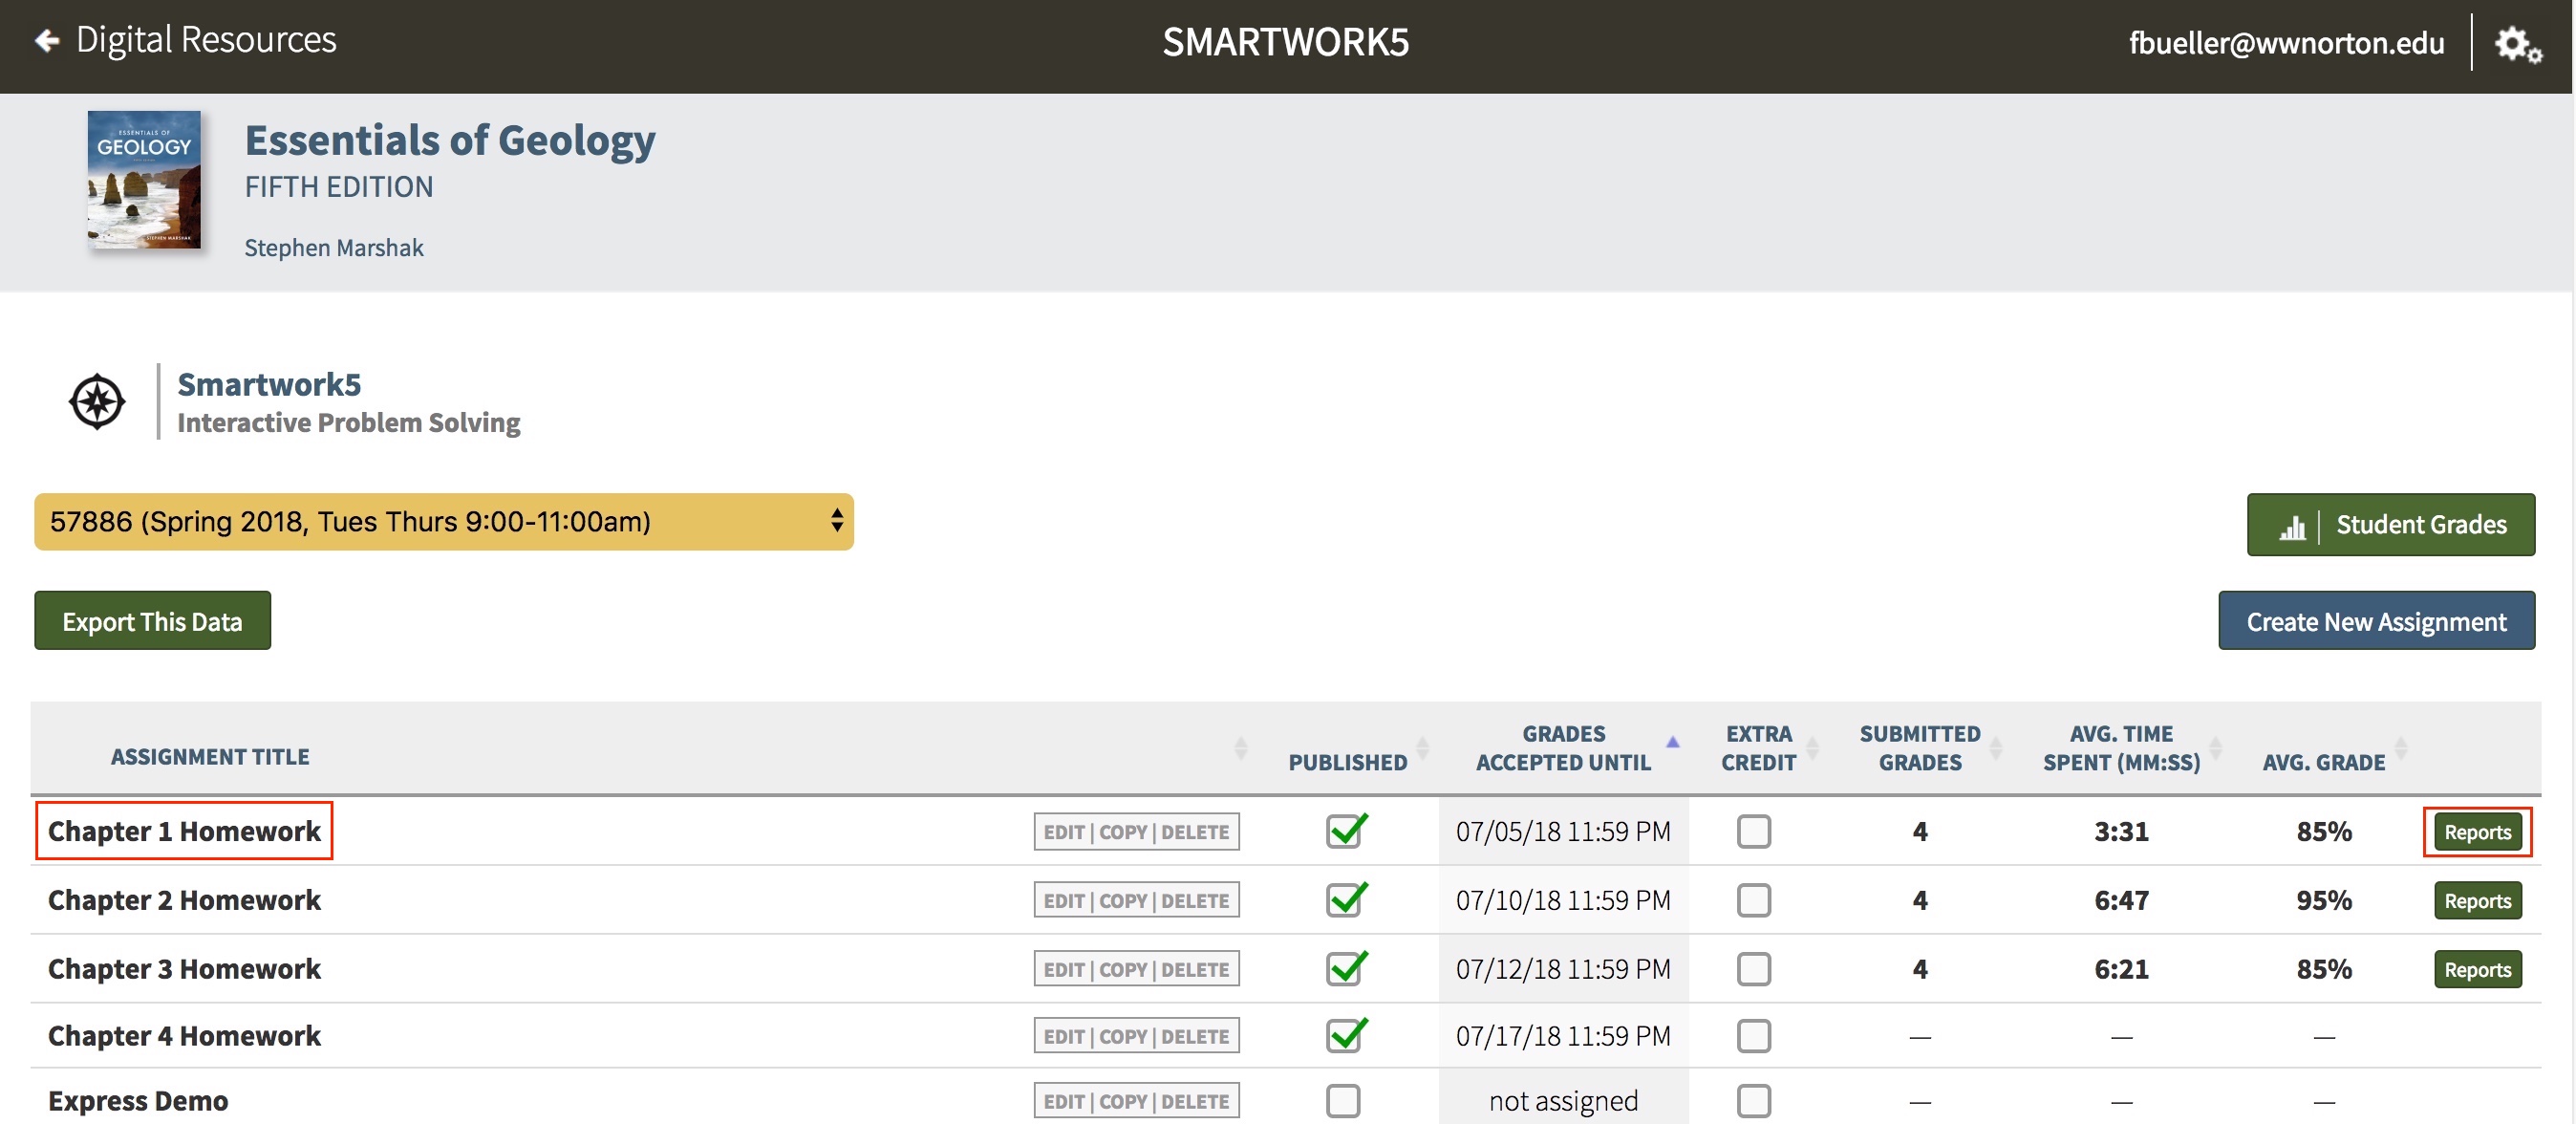
Viewing In-Depth Performance Reports For Each Assignment
You can view student results on an assignment level by going to the Class Activity Report for a particular assignment.
Class Activity Report
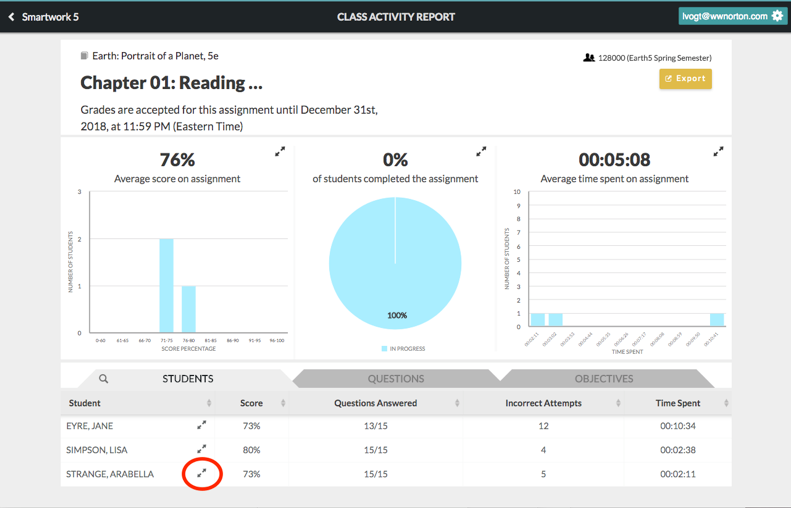
The Class Activity Report provides in-depth reports on individual student and class-wide performance on the assignment. The Class Activity Report breaks the results down in three ways: by student, by question, and by objective.
Getting Started
The "Reports" button redirects you right into the Class Activity Report.
The Class Activity Report allows you to view an aggregate of data from all students who completed the assignment, or data from students in a particular Student Set. Once in the Class Activity Report, you can change the Student Set you are viewing by selecting a particular Student Set from the Student Set dropdown menu underneath the assignment name.
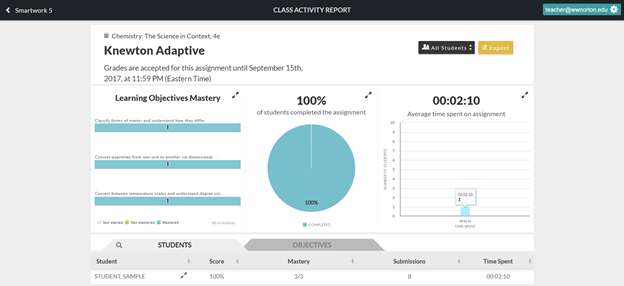
If the assignment is a Fully Adaptive Assignment (Chemistry Assignments only) , you would see a slight change in the Class Activity Report.
You can export all of the data in this page to a .csv or .pdf file by clicking the "Export" button.
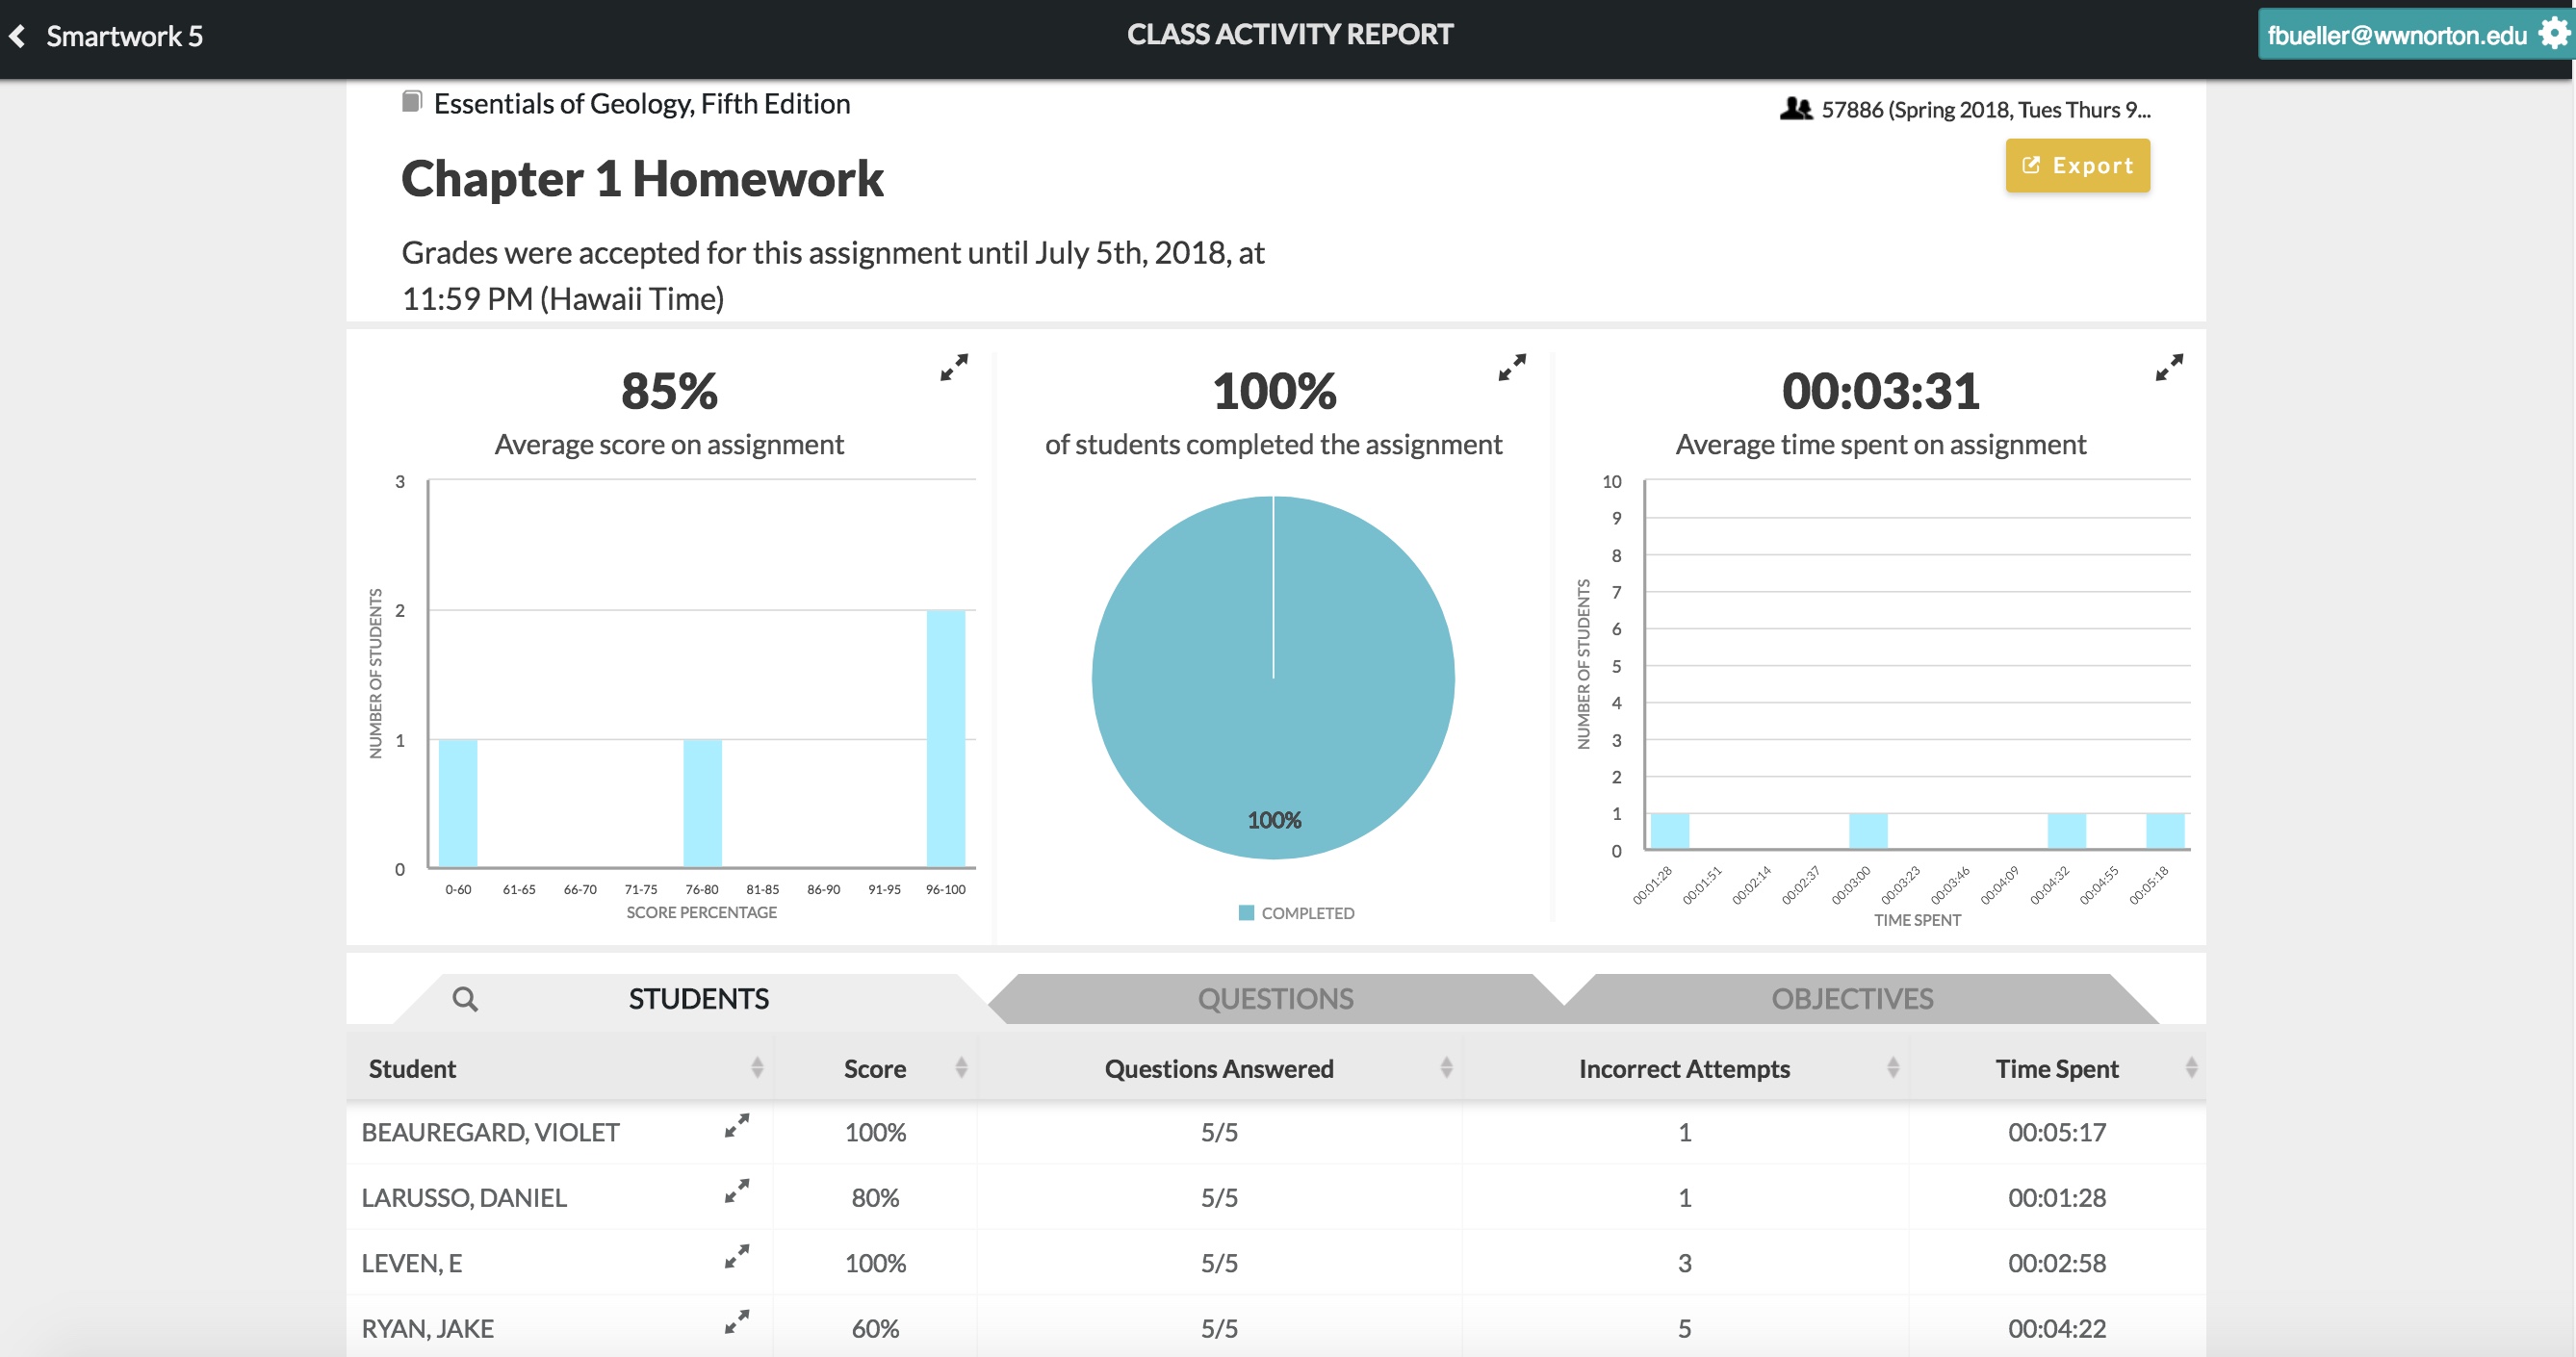
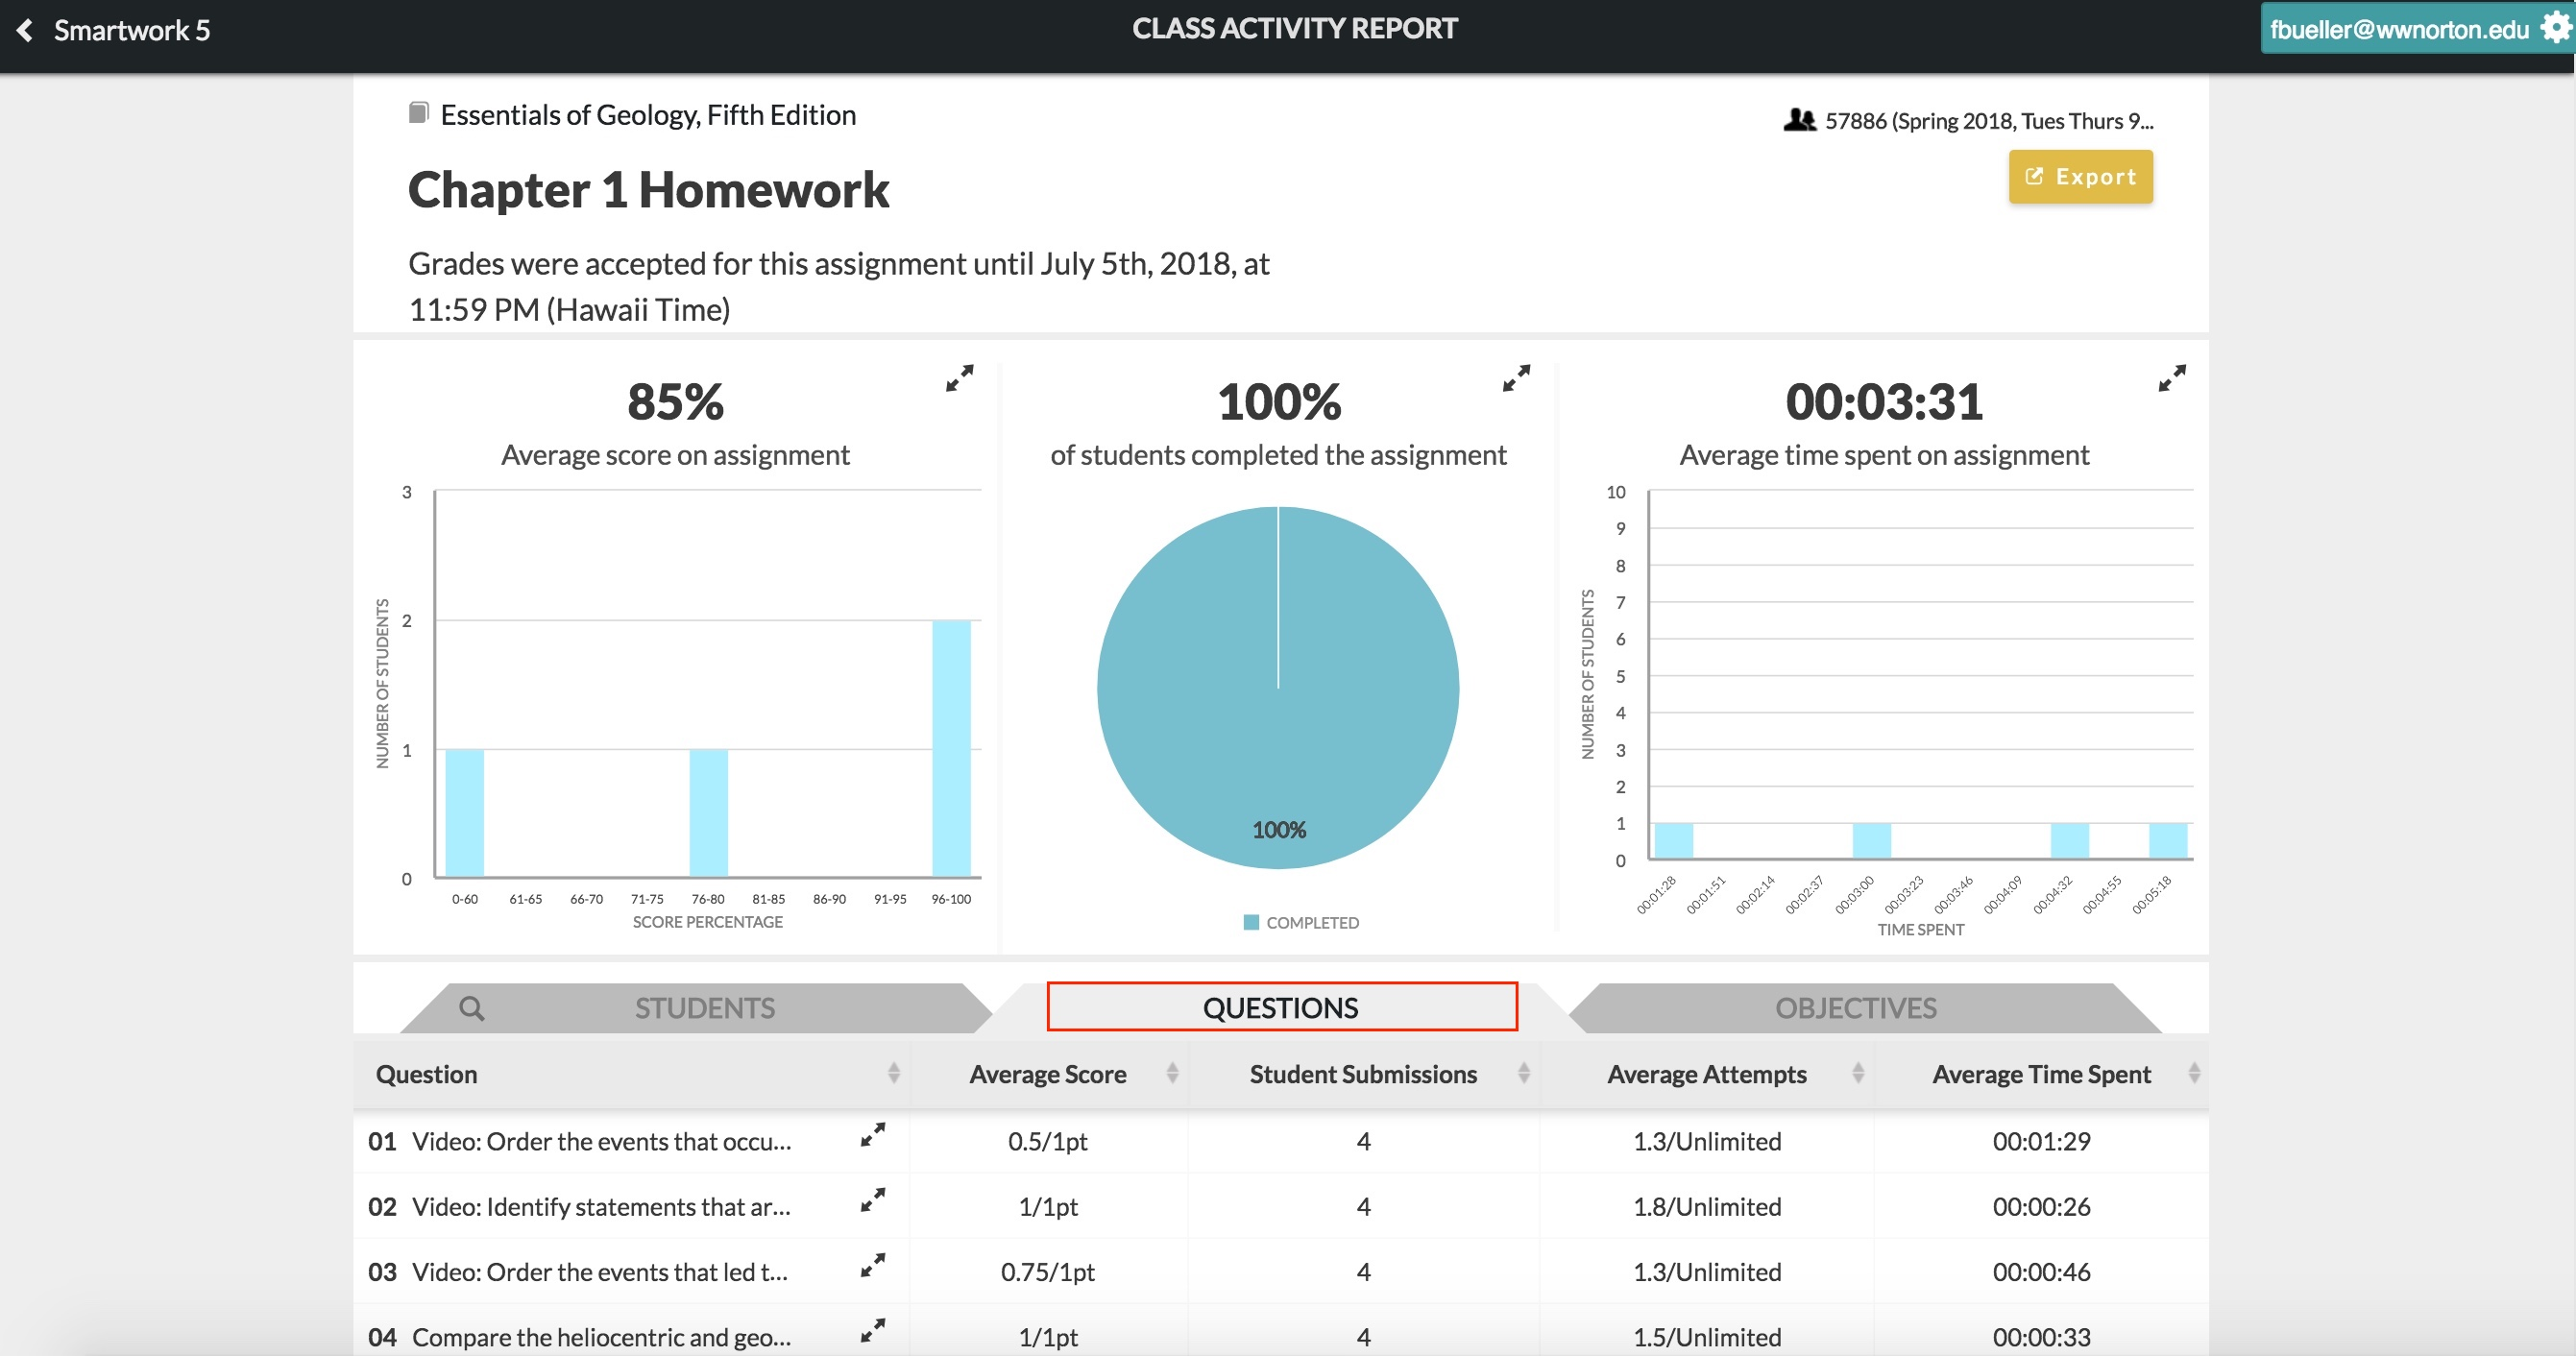
Graphs
The Class Activity Report contains three graphs, all of which are located in the top half of the report:
- A bar graph displaying the frequency of student grades
- Note about Fully Adaptive Chemistry Assignments: in these assignments only, there is a horizontal bar graph displaying how many students have completed the Learning Objective Mastery.
- A pie chart displaying the number of students who completed, started, and have not yet started the assignment
- A bar graph depicting the average time students spent working on the assignment
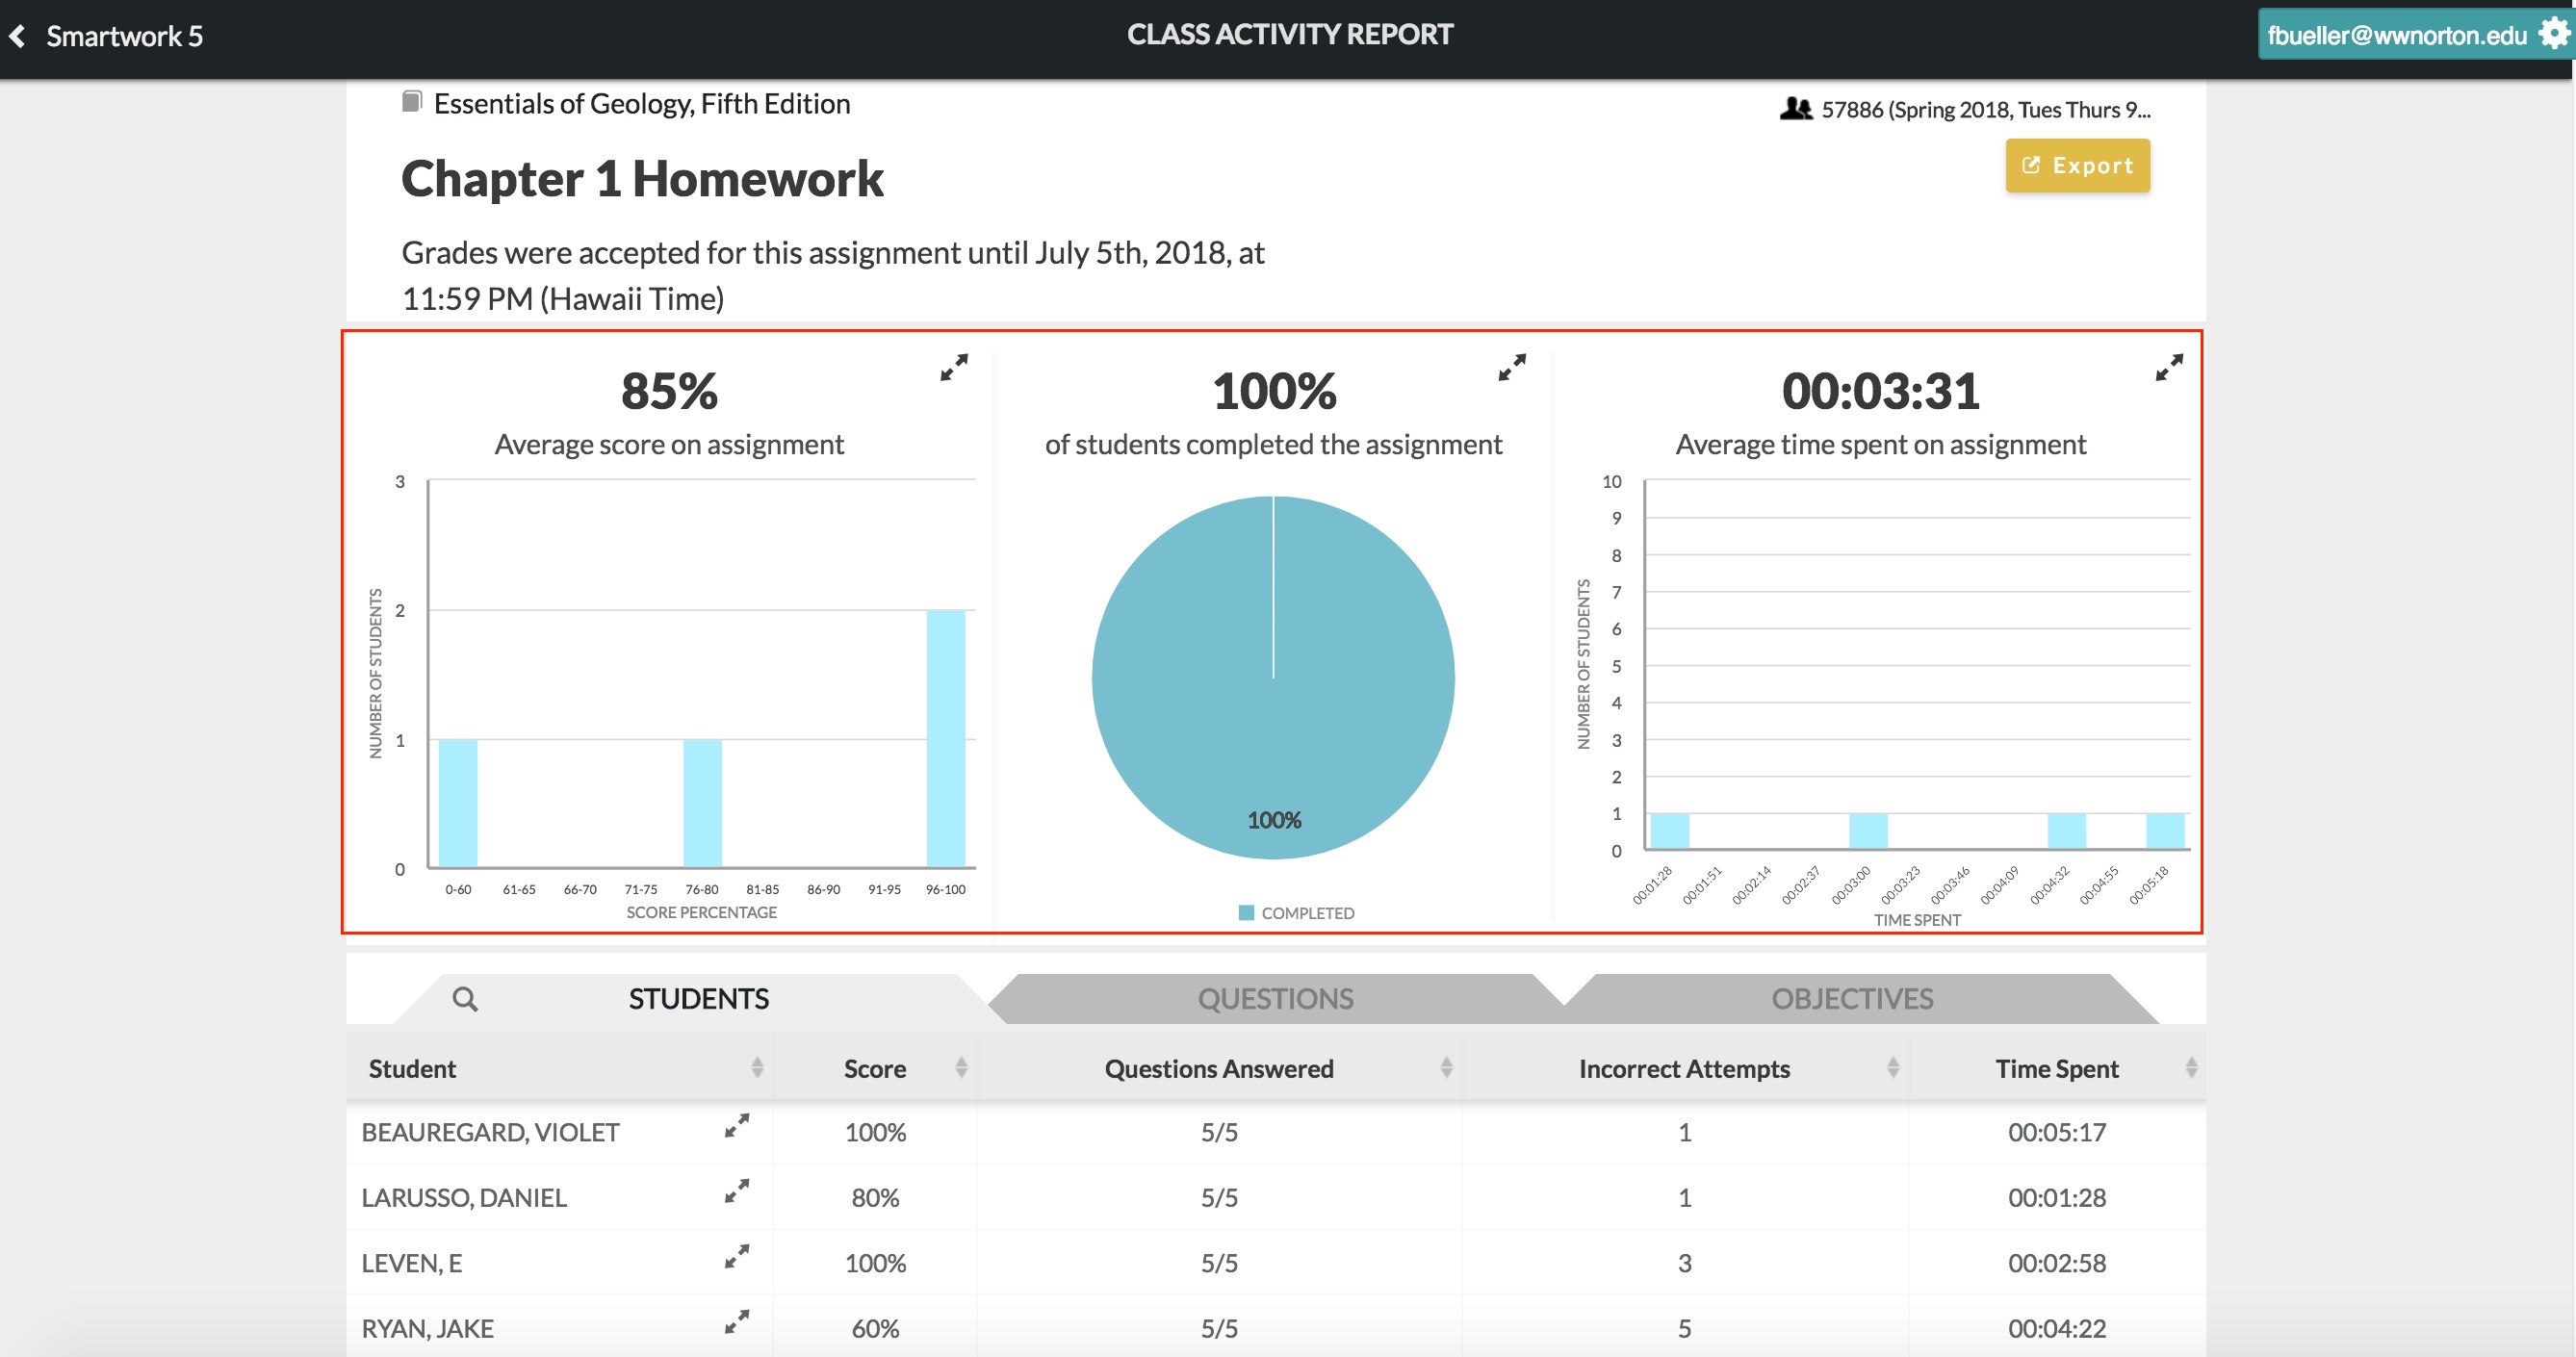
You can expand each graph by clicking on the arrows located in the graph’s upper right-hand corner.
Students Tab
The Students tab displays student performance on the assignment by student. By default, this is the first tab that displays in the Class Activity Report. In this tab, you will find data for each student on the following topics:
- Score – the student's score on the assignment, displayed as a percentage.
- Questions Answered – the number of questions the student answered out of the total number of questions in the assignment.
- Incorrect Attempts – this displays the total number of incorrect attempts the students made on the questions in the assignment.
- Time Spent – the total time the student spent working in the assignment.
You can also search for a particular student’s results by clicking on the magnifying glass icon, located in the left corner of the Student tab. Clicking this icon will bring up a search bar, which you can use to search by student name.
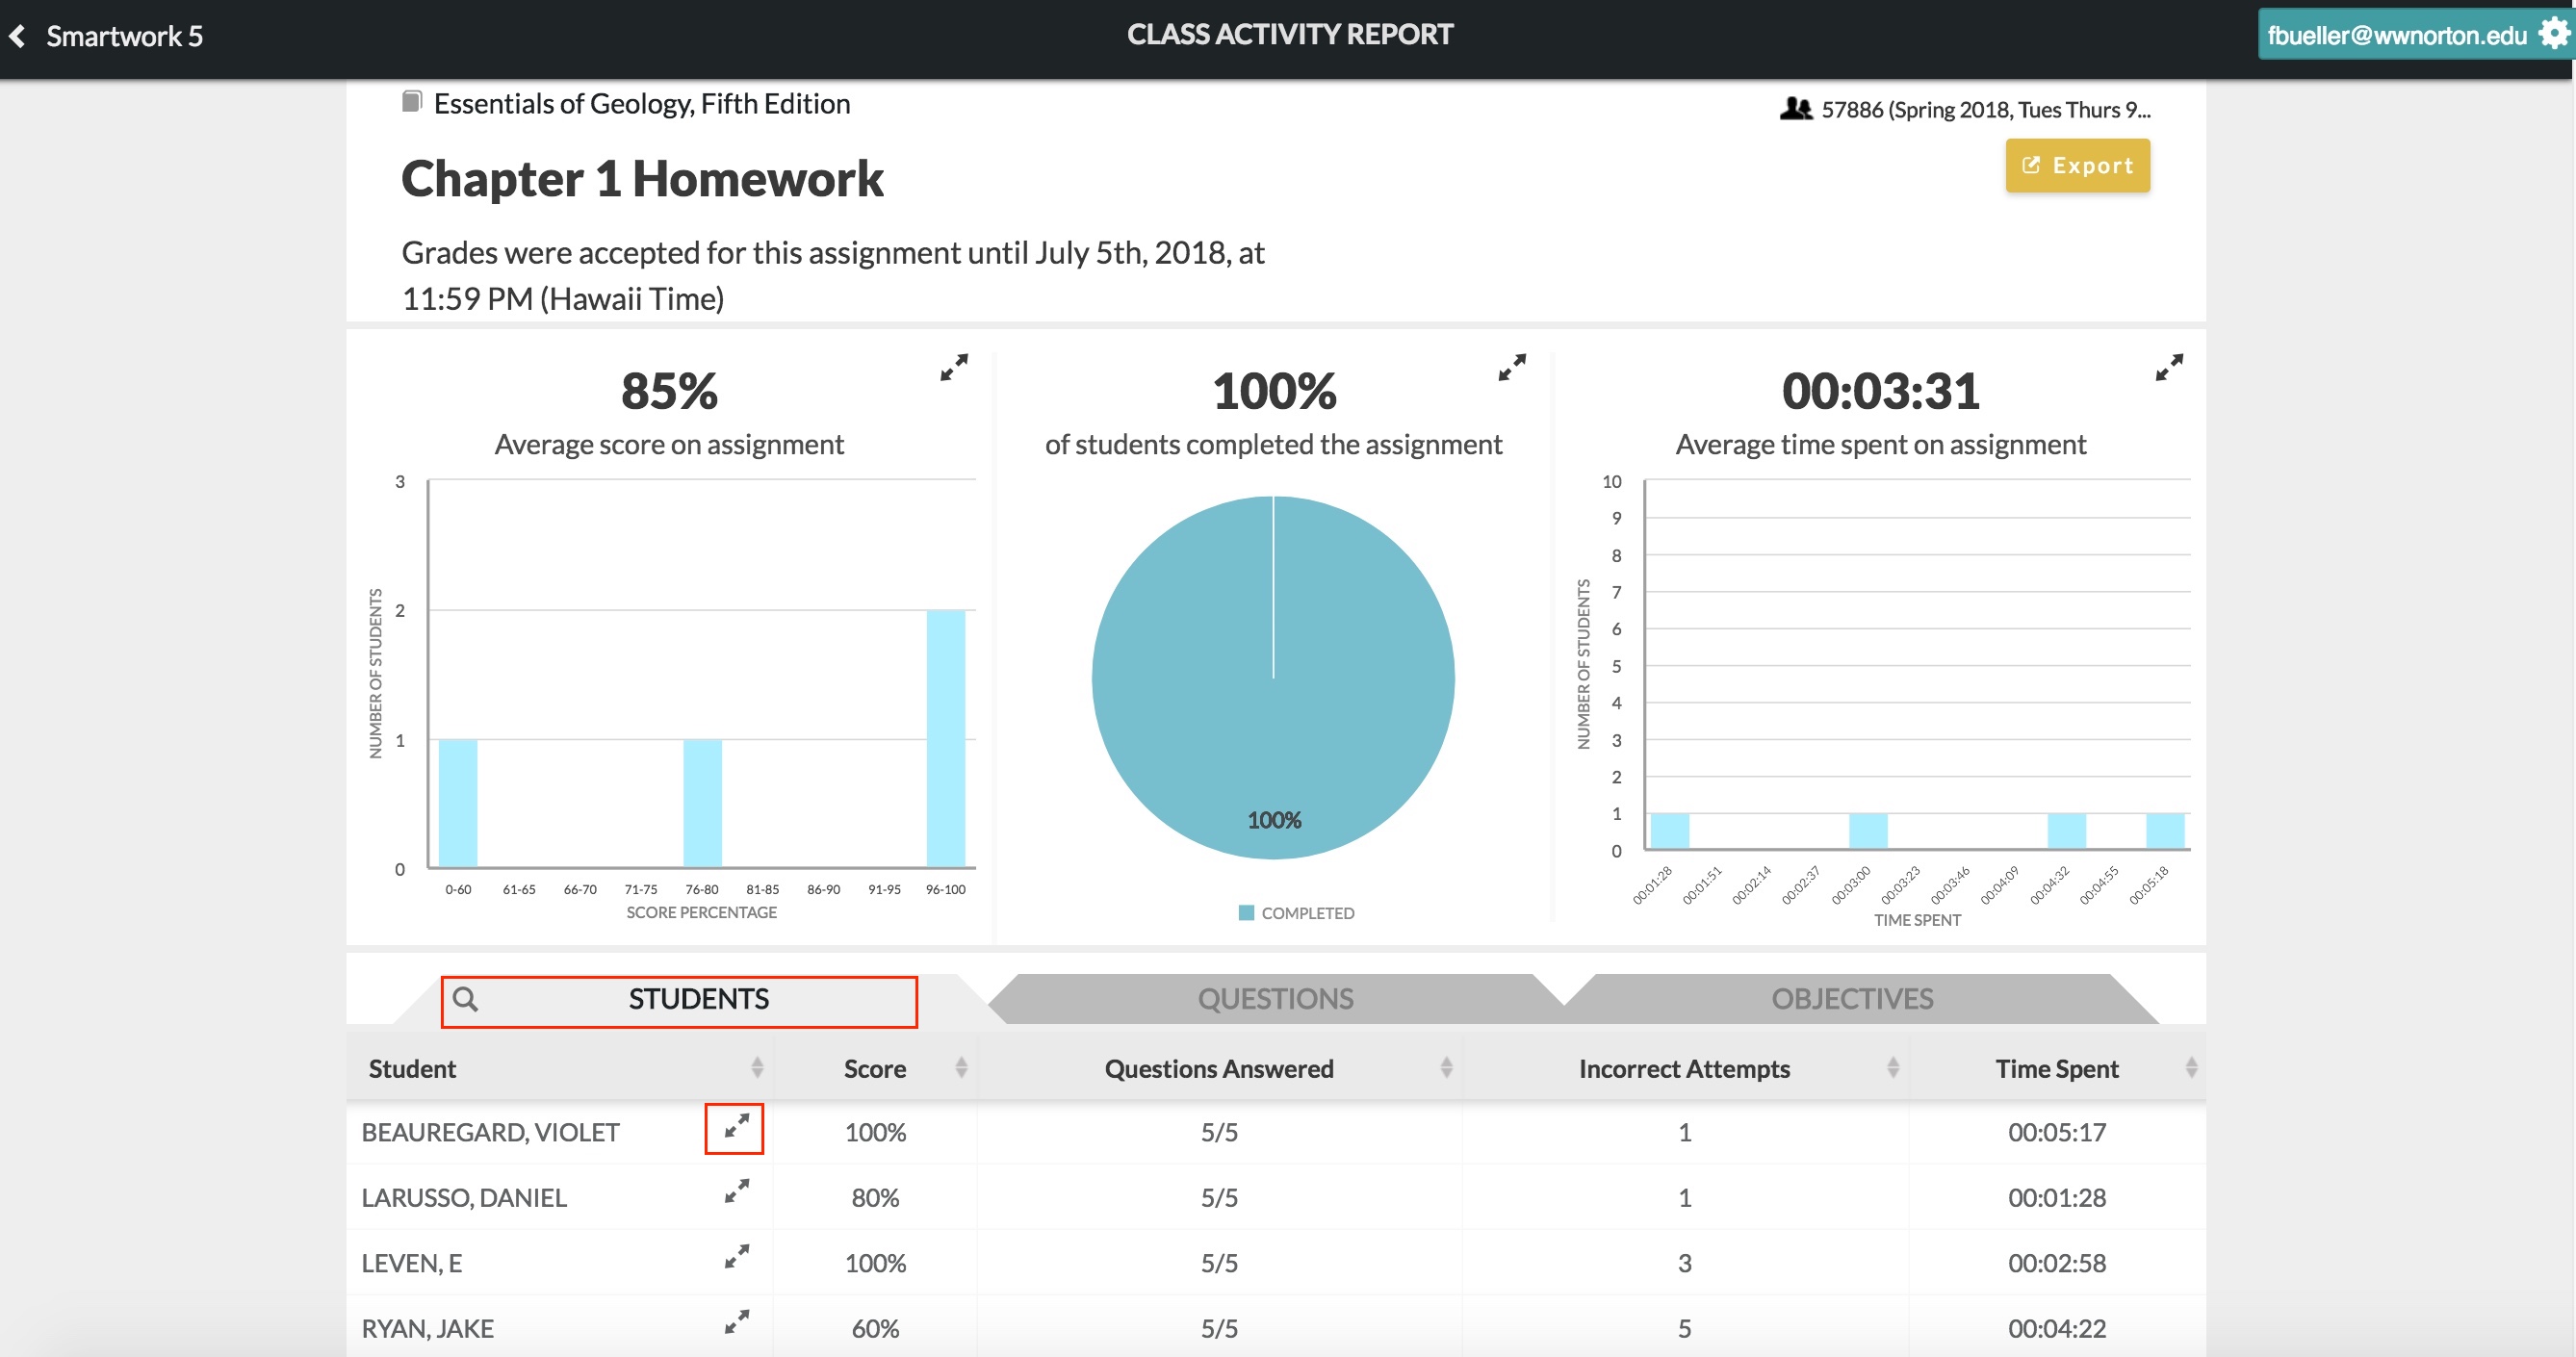
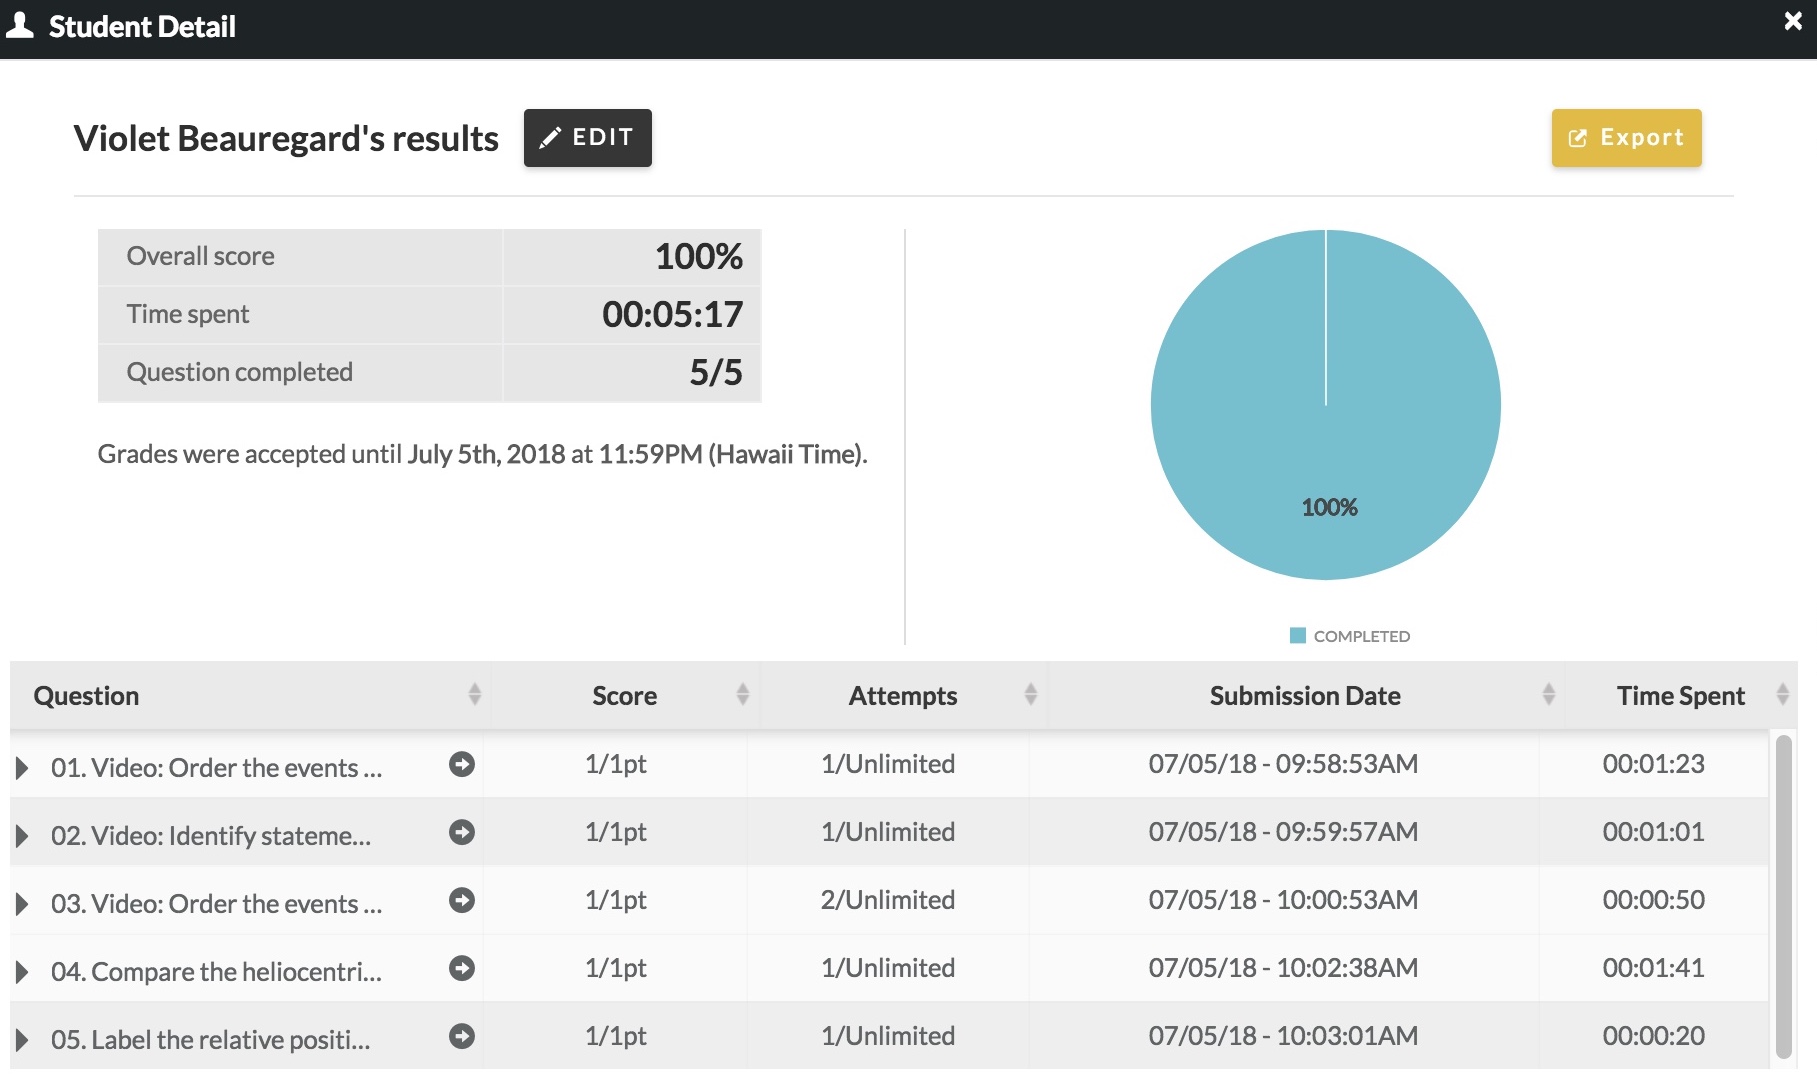
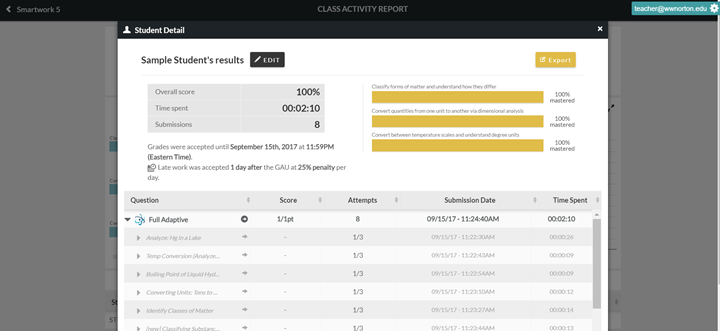
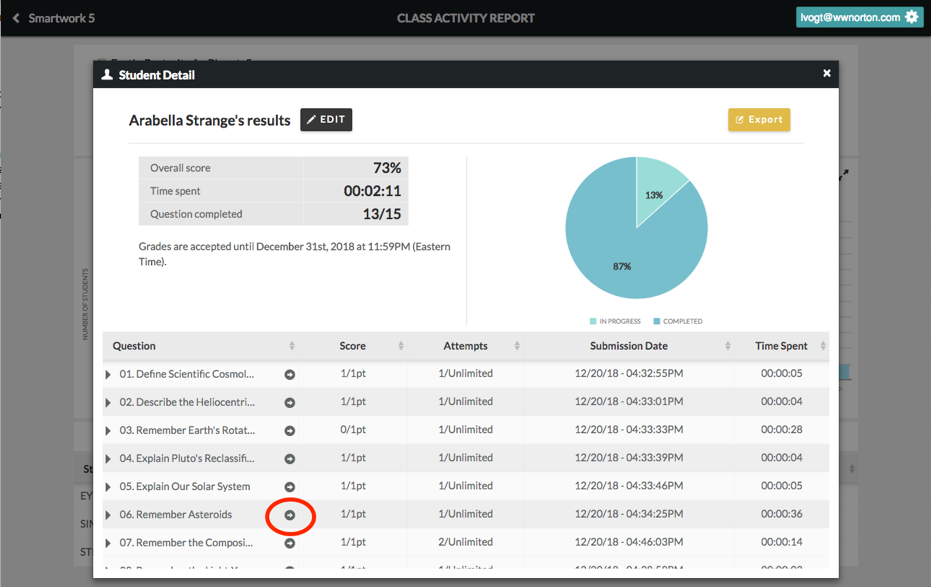
From the Students tab, you can also view an in-depth report of how each student performed on each question. To see this review, known as the Student Detail overlay, click on the "expand" arrows next to the name of the student you would like to see results for.
In the Student Detail Overlay, you will find the following information:
(Normal Assignment)
- Overall Score – the total score the student earned on the assignment, as a percentage.
- Time Spent – the total amount of time the student spent on the assignment.
- Questions completed– the number of questions the student completed. This is displayed as a fraction, out of the total number of questions.
Furthermore, the table in the Student Detail Overlay gives you the following information:
- Score – the number of points the student earned on each question in the assignment. This is presented as a fraction out of the total number of points the student could have earned on the question.
- Attempts – the number of attempts the student used when answering the question. This is displayed as a fraction, out of the total number of attempts.
- Submission Date – this lists exactly when the student completed the question by a) exhausting her attempts, b) answering correctly, or c) giving up and viewing the solution. The penalty icon next to the submission date indicates a late submission.
- Time Spent– the amount of time the student spent answering the question.
If a Knewton adaptive portion has been included in a Chemistry assignment, you would see the Knewton Logo next to the specific part; you can expand this logo and receive more details about the questions that each student has answered.
 (Fully Adaptive Assignment)
Clicking on the "Export" button gives you the option to export the information in the Student Detail Overlay to a .pdf or a .csv file.
Question Tab
The Question tab is located to the right of the Students tab, and displays student results by each question in the assignment.
In this tab, you will find data for each question in the following topics:
- Average Score – this gives you the average score students received out of the total number of possible points for the question.
- Student Submissions – this gives you the total number of students who successfully submitted the question for a grade.
- Average Attempts – this gives you the average number of attempts students made on the question before answering it correctly, running out of attempts, or giving up on the question.
- Average Time Spent – this gives you the average time students spent on the question.
- Knewton Adaptive for Chemistry (Warm-up or Follow-up)– you'll see a Knewton Adaptive logo which you can expand and see (once completed) the specific questions that were answered to successfully master the objectives.
From the Questions tab, you can also view an in-depth report of how each student in your class did on a particular question, known as the Question Detail overlay. To access this, click on the arrows next to the question for which you would like to see results.
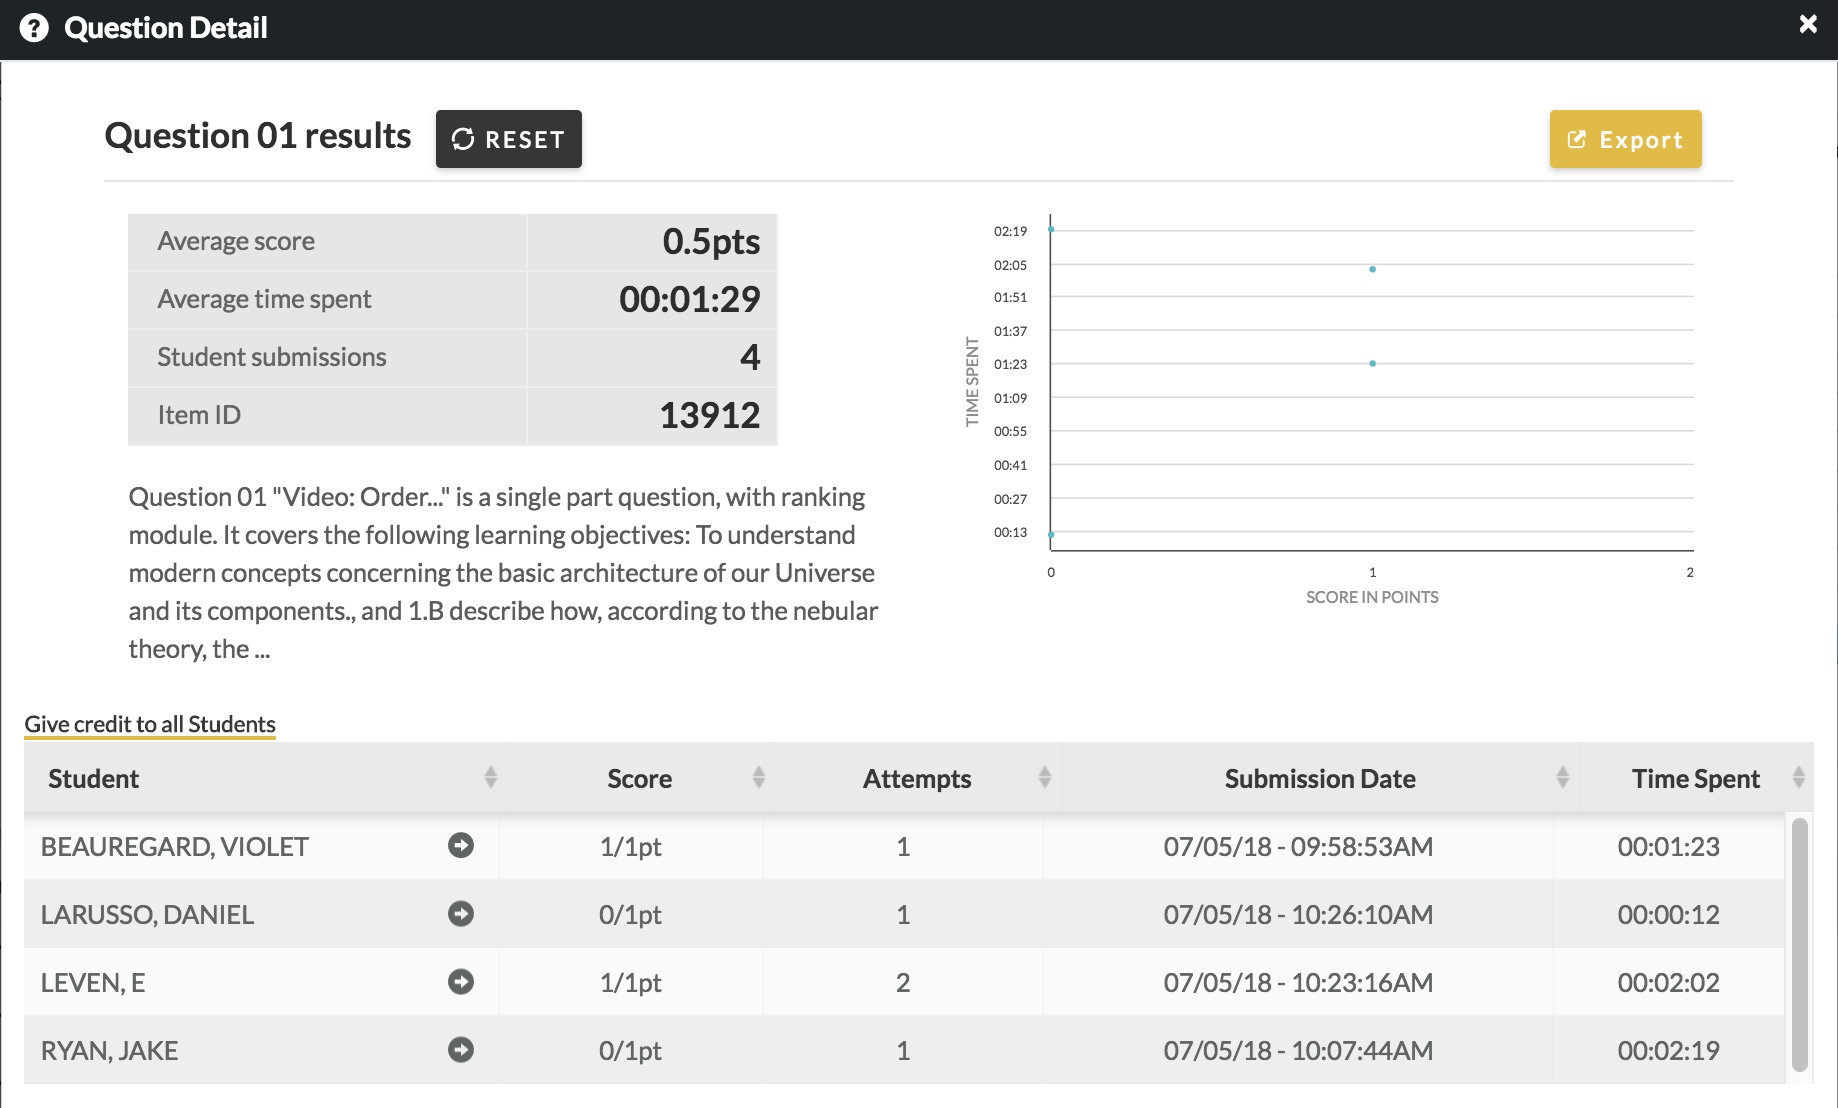
In the Question Detail Overlay, you will find the following information:
- Average Score – this lists the average score students earned on this question.
- Average Time Spent – this lists the average time the students spent on this question.
- Student Submissions – this lists the number of students who successfully submitted their answers for this question. A successful submission constitutes the following: a) getting the answer correct, b) exhausting answer attempts, and c) giving up on the question and viewing the solution.
Additionally, you will find a paragraph with information about the question’s title, the number of modules it contains, and the learning objectives it covers. You will also find a scatterplot detailing the amount of time students spent on the question verses the number of points they earned.
Furthermore, the table in the Question Detail Overlay gives you the following information:
- Score – this lists the number of points students earned on the question in the assignment. This is presented as a fraction out of the total number of points the student could have earned on the question
- Attempts – this lists the number of attempts the student used when answering the question.
- Submission Date – this lists exactly when a student completed the question by a) exhausting her attempts, b) answering correctly, or c) giving up and viewing the solution.
- Time Spent – the amount of time students spent answering the question.
You can also see exactly how students answered the question by clicking on the "expand" arrows next to the name of the student.
Clicking on the "Export" button gives you the option to export the information in the Student Detail Overlay to a .pdf or a .csv file.
Objectives Tab
The Objectives tab is located to the right of the Questions Tab, and displays class-wide performance by each learning objective covered in the assignment. Learning objectives are brief learning goals that are associated with a particular chapter and section in the textbook. Not all questions are tied to a learning objective.
For Knewton Adaptive learning objectives in Chemistry, you would see a Knewton logo indicating the adaptive component to the learning objective.
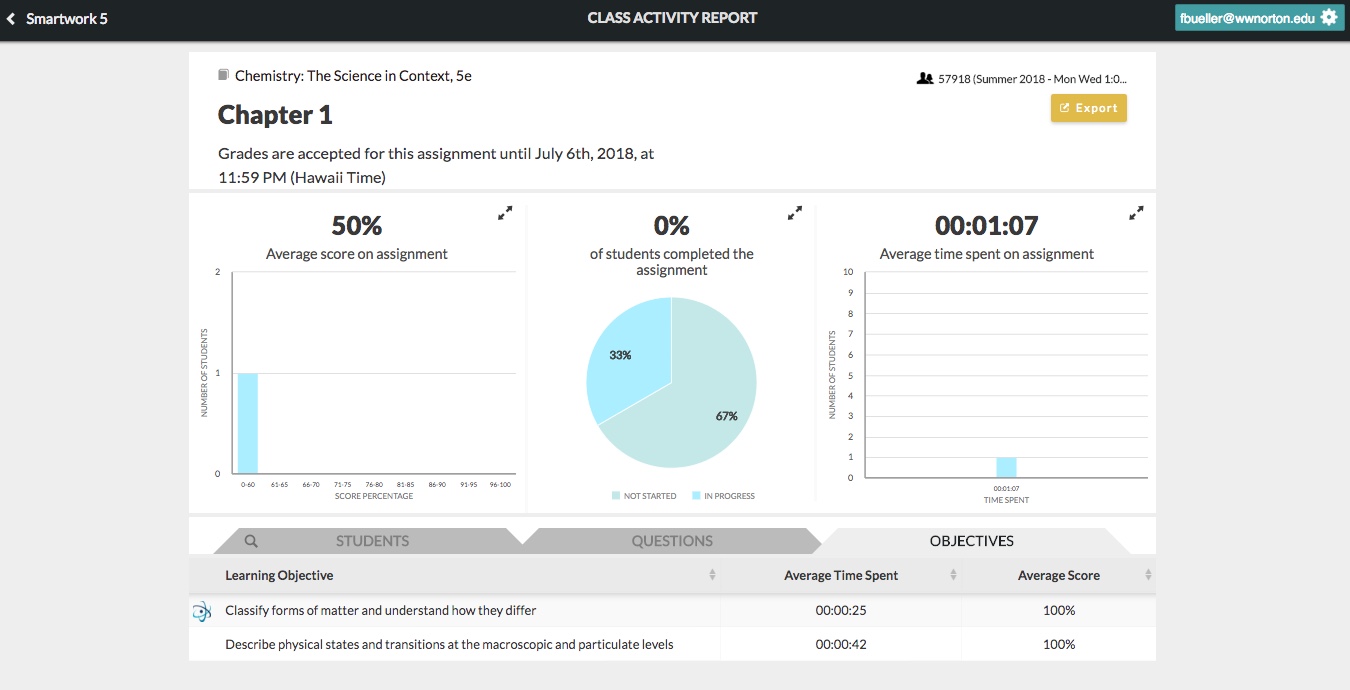
In this section, you will find data on each learning objective in the following topics:
- Average Time Spent – the average time students spent on questions associated with this learning objective.
- Average Score – the average score students received on questions associated with this learning objective.
Viewing Student Answer Attempts
You can choose to view every answer attempt by your students; this is useful if you want to see the incorrect answers that a particular student submitted in order to see their thought process or the evolution of their answers. Here is how to see any student’s answer attempts:
- Log in, using your instructor account, and then enter the desired Student Set through the dropdown menu at the top-left of the page.
- Enter the assignment that you wish to look at, then click Class Activity Report. Find the name of the student whose answer attempts you wish to review, and click on the expander icon next to the name.
- A Student Detail window will pop up. Find the question that you want to see the student’s answer attempts for and click on the arrow to the right of the question title.
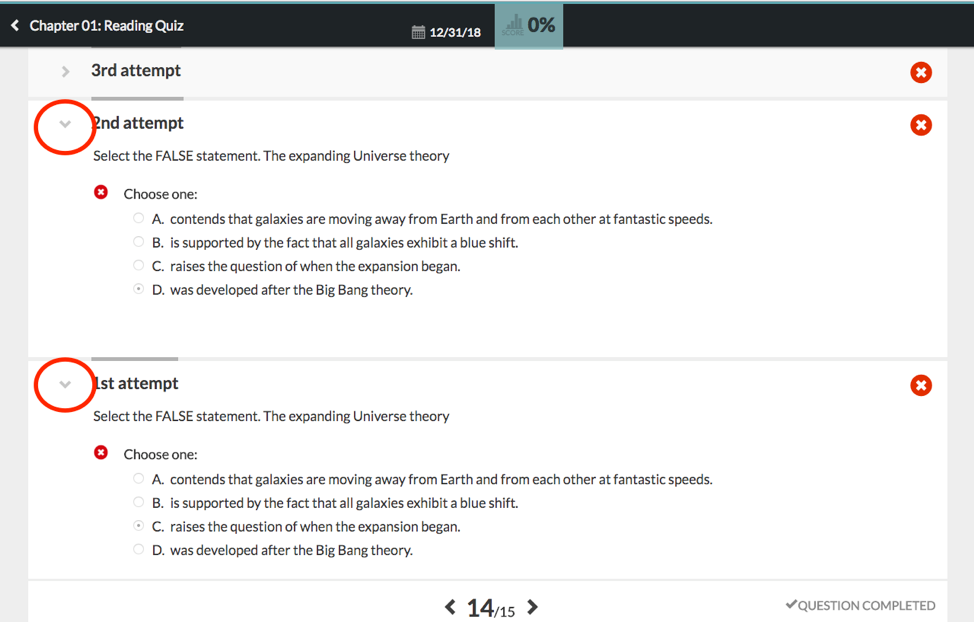
- This will open a new tab, which shows all of the student’s answer attempts.
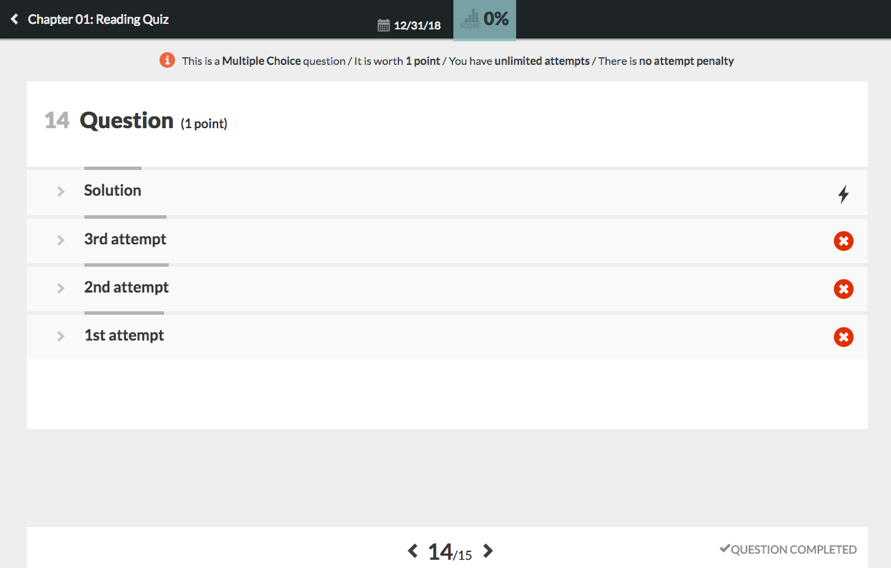
- Click on the expander arrow next to each attempt to open it.


Still need help? Submit a support ticket and a customer support specialist will be happy to assist you.Submit a Support Request
Opened a request already? Click here for an update.